Author: MaryAnne Knight
-

July 9, 2026, NOAA Weather Outlooks
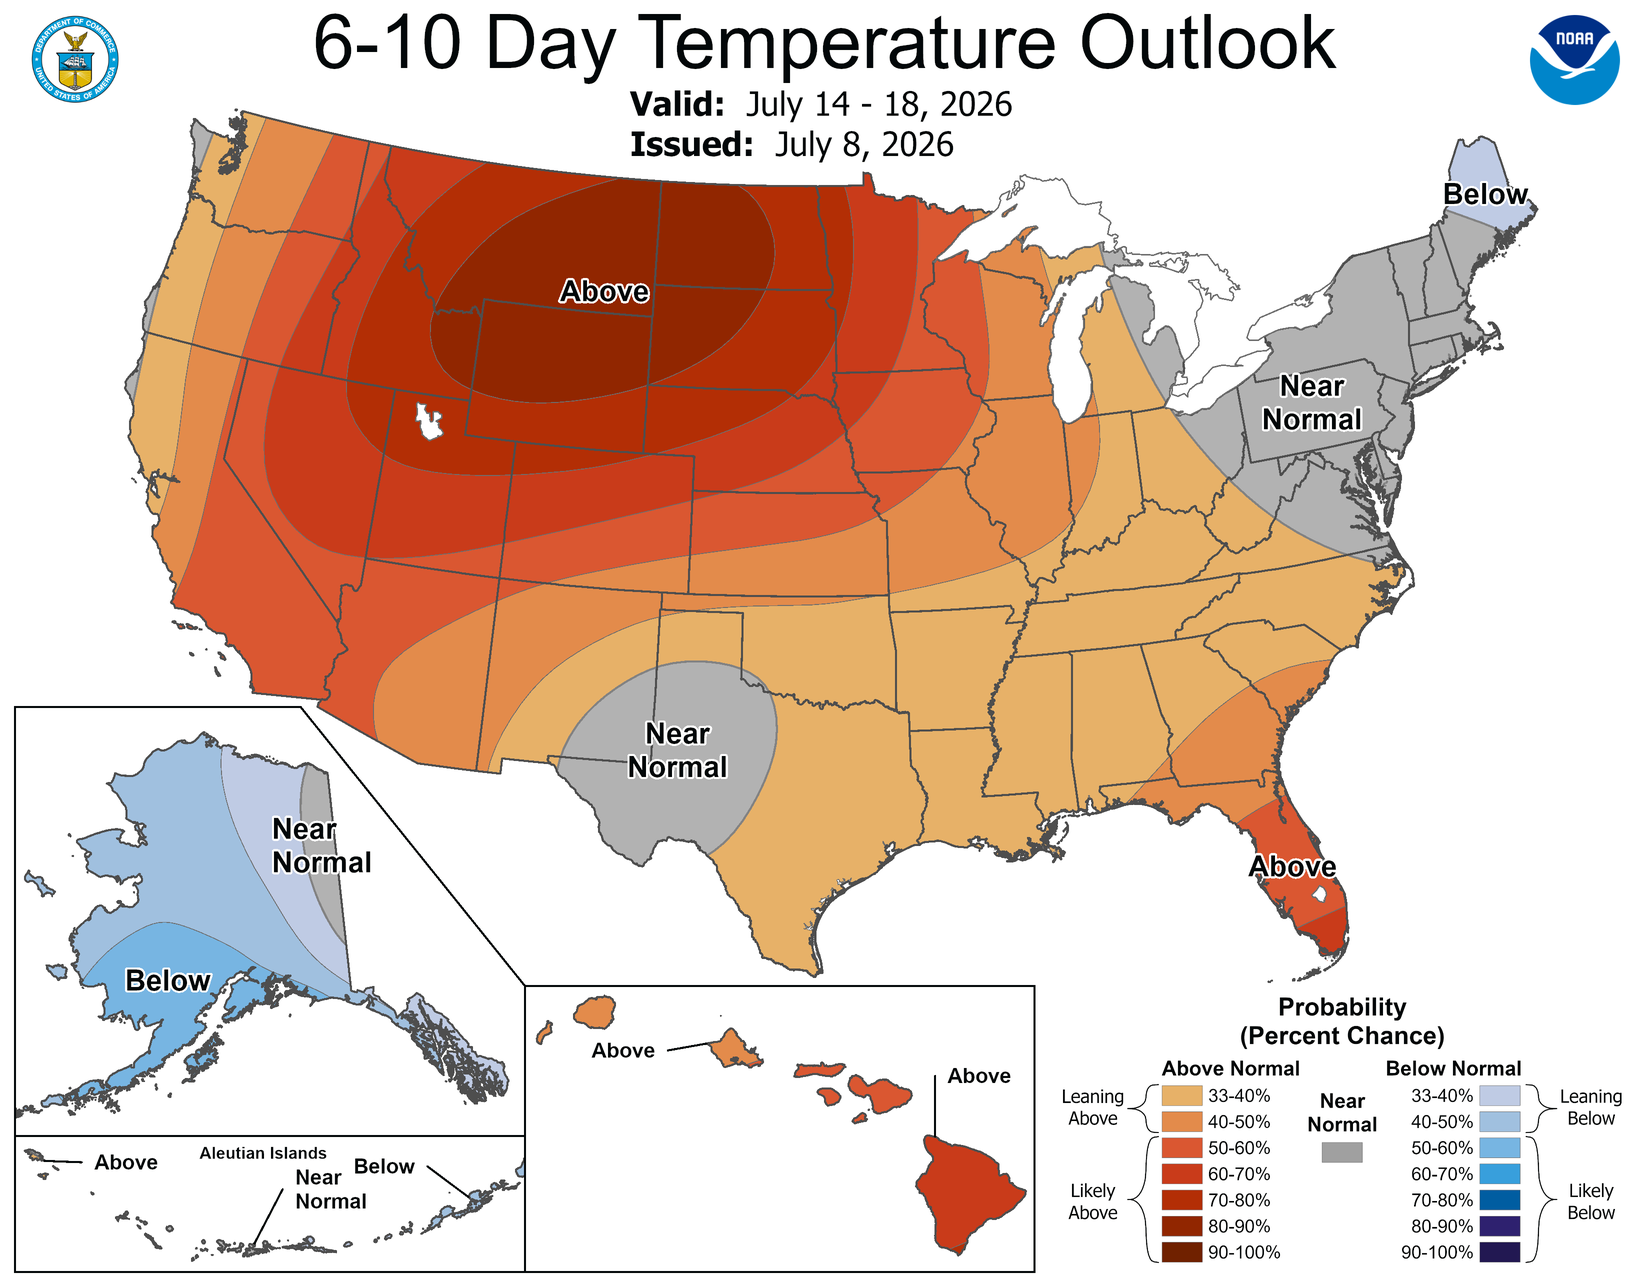
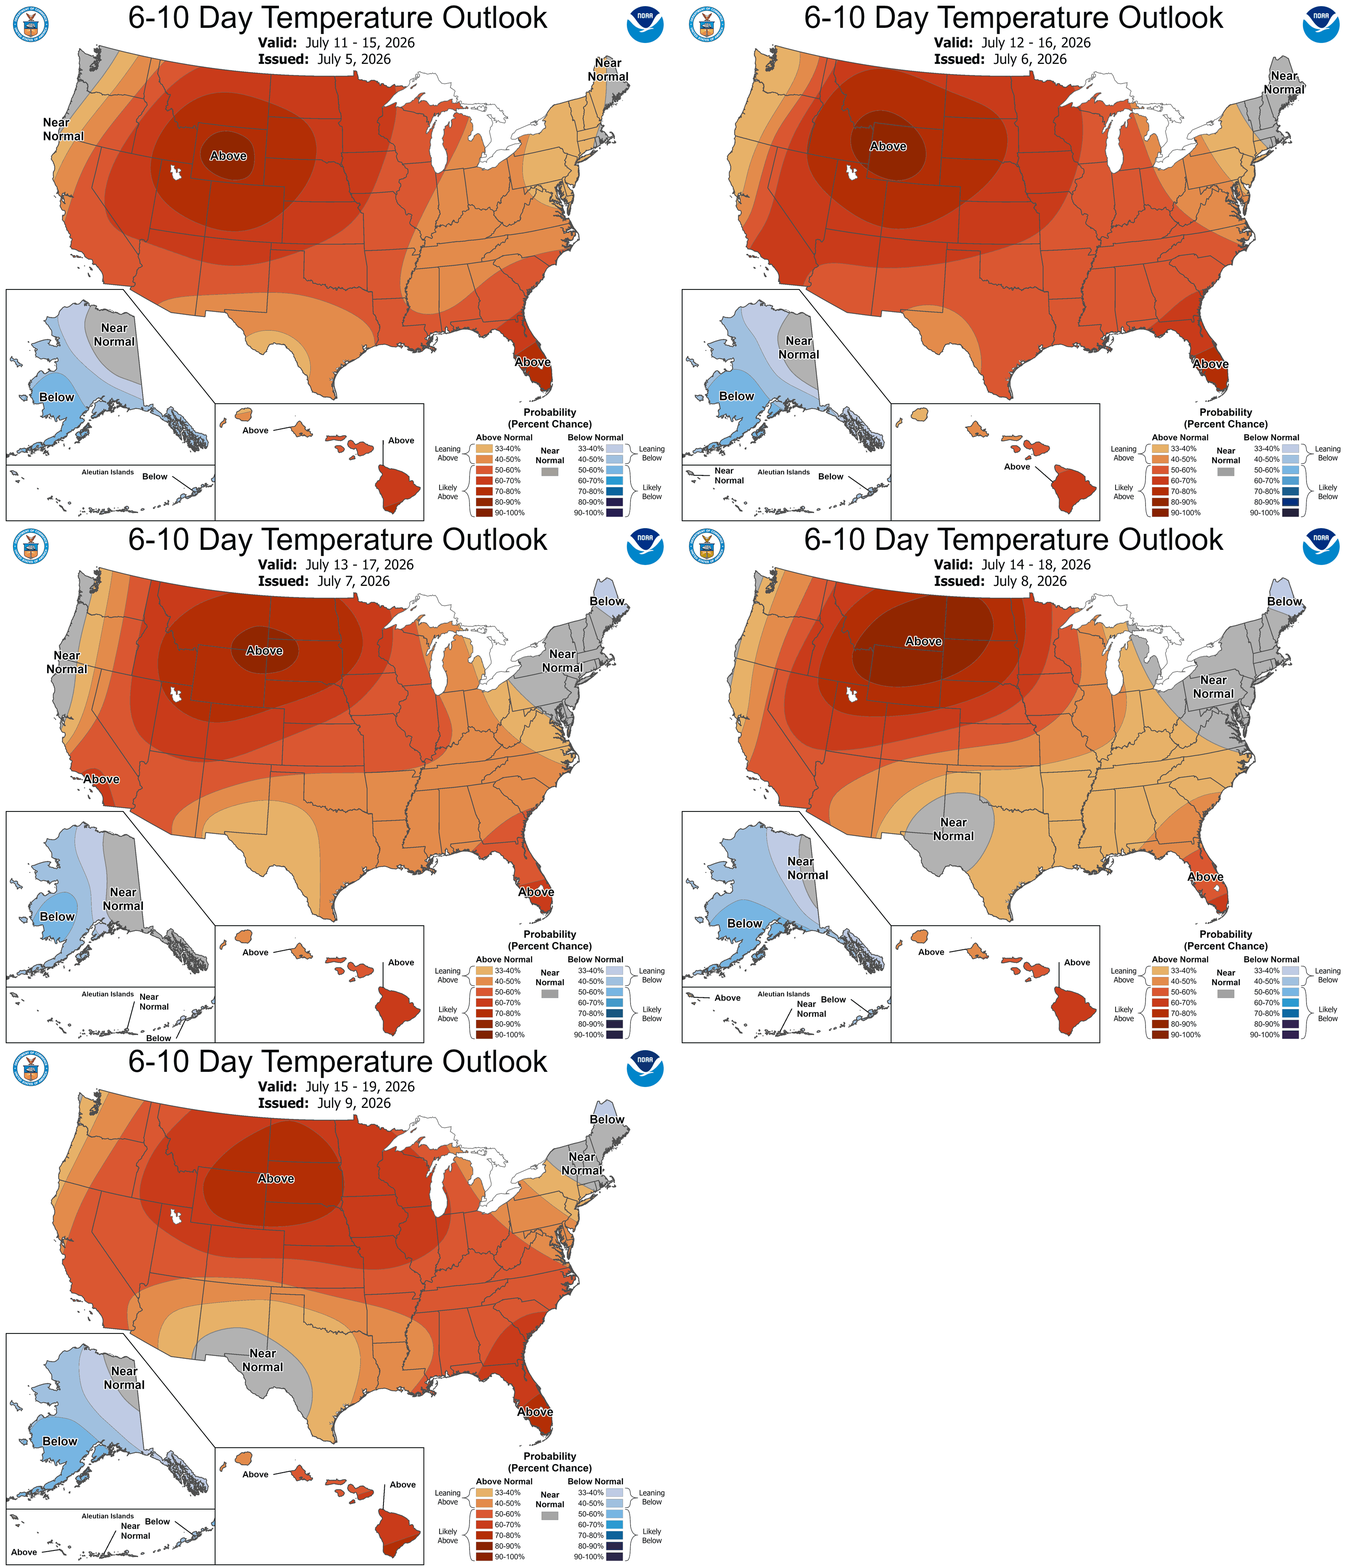
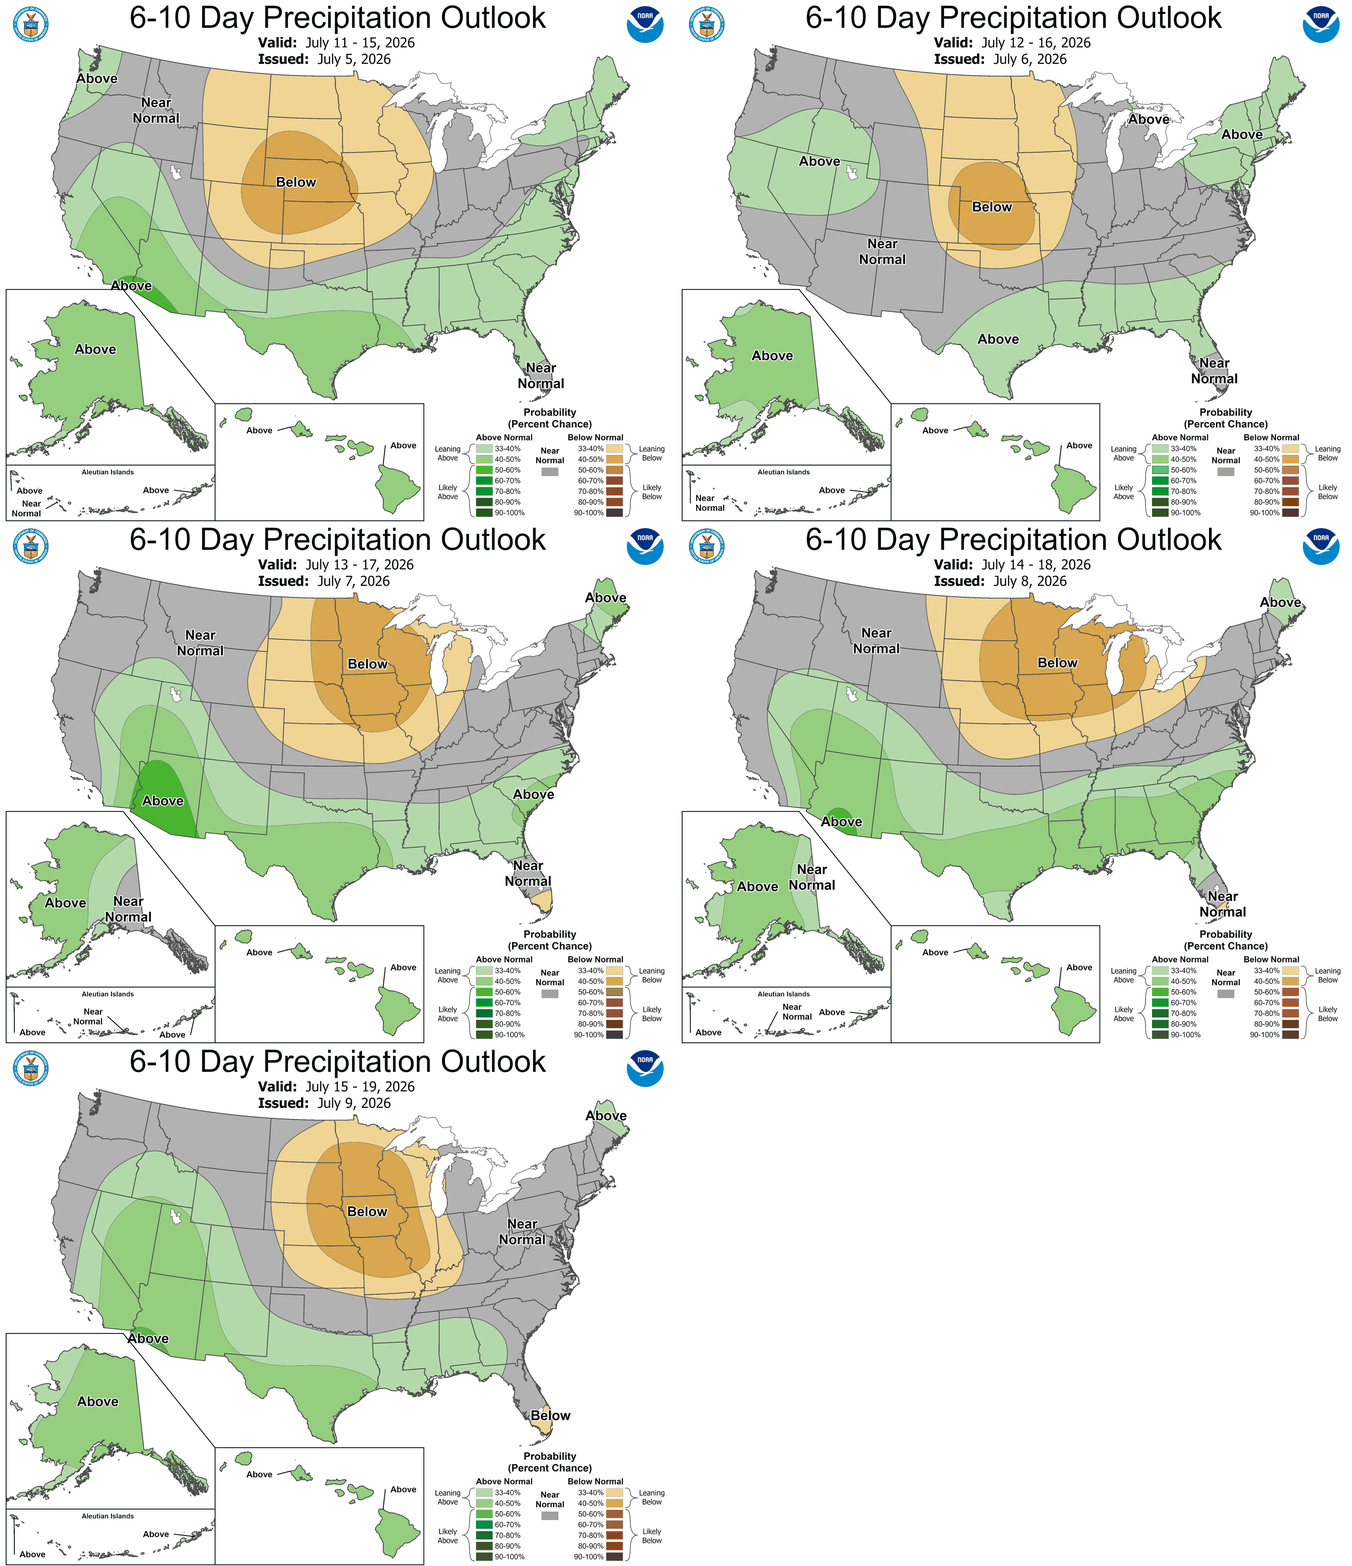
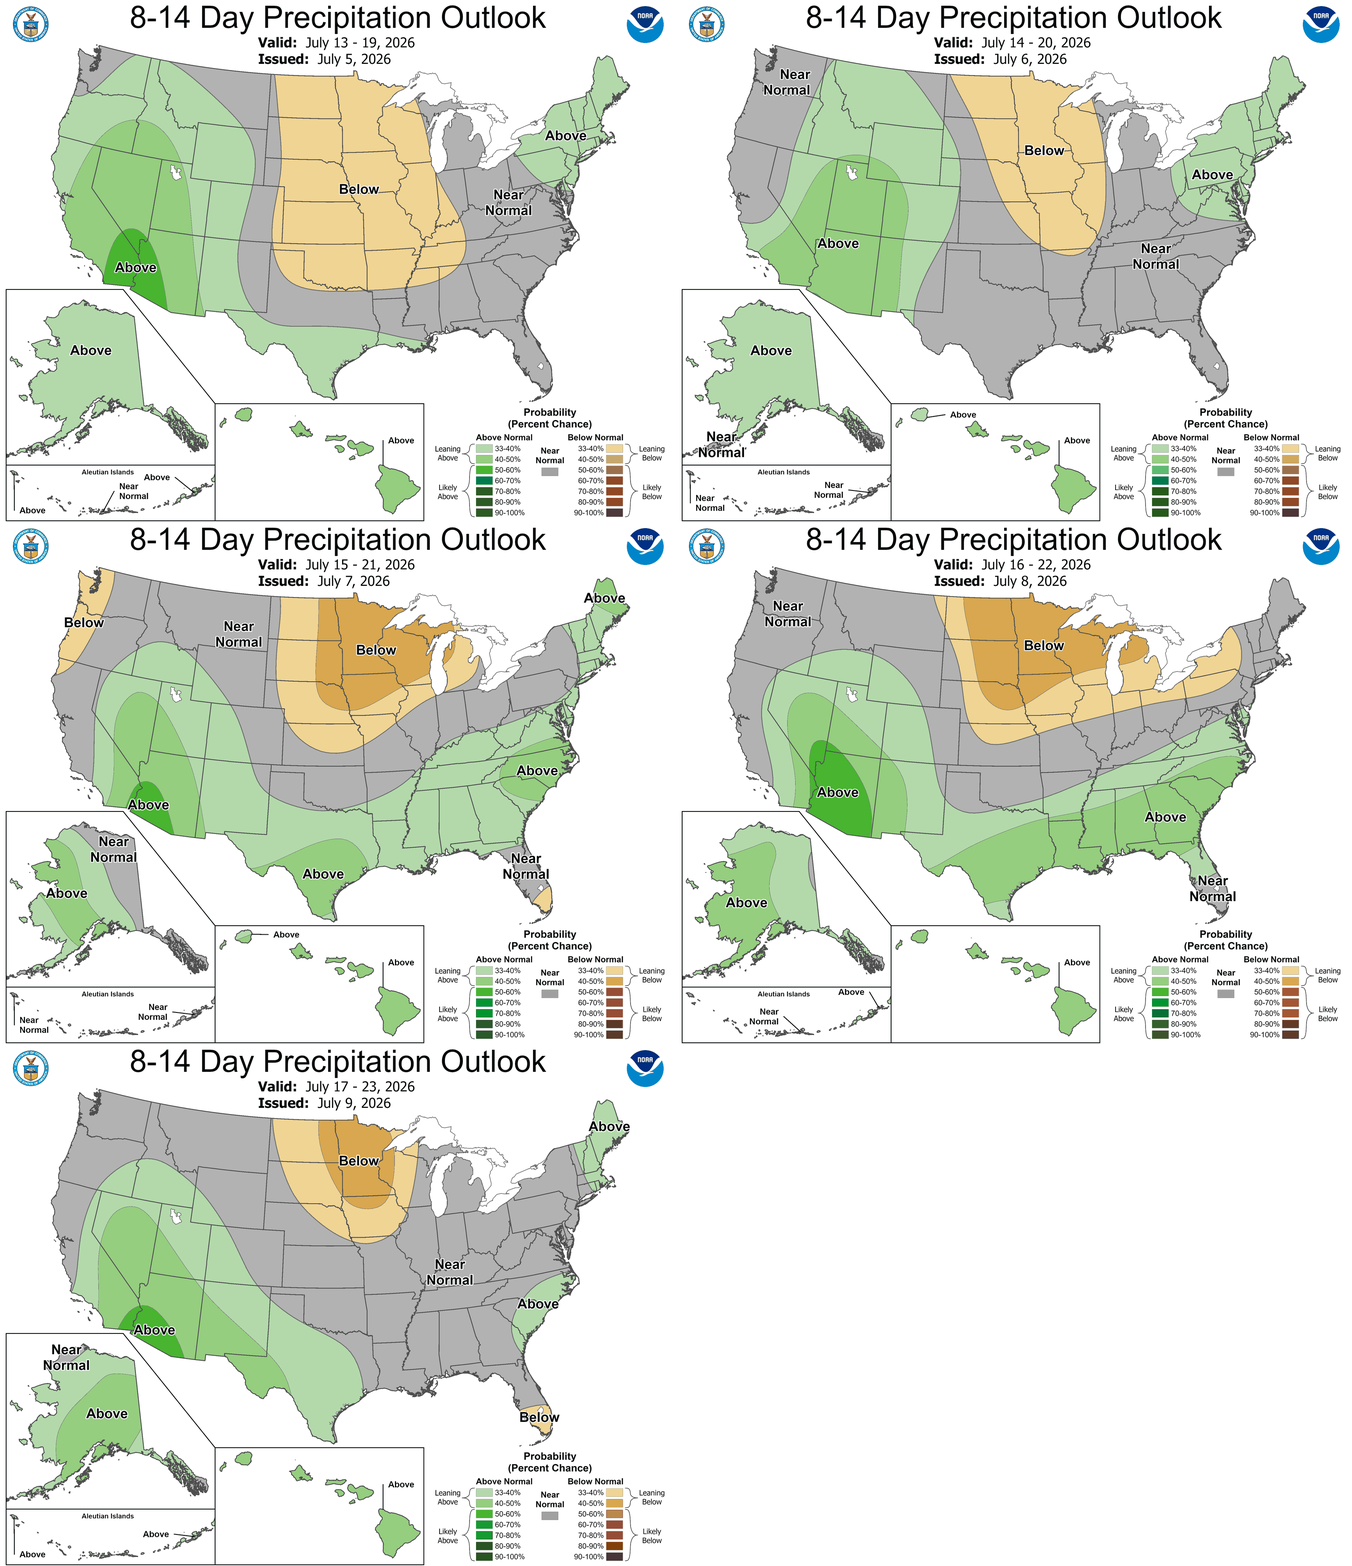
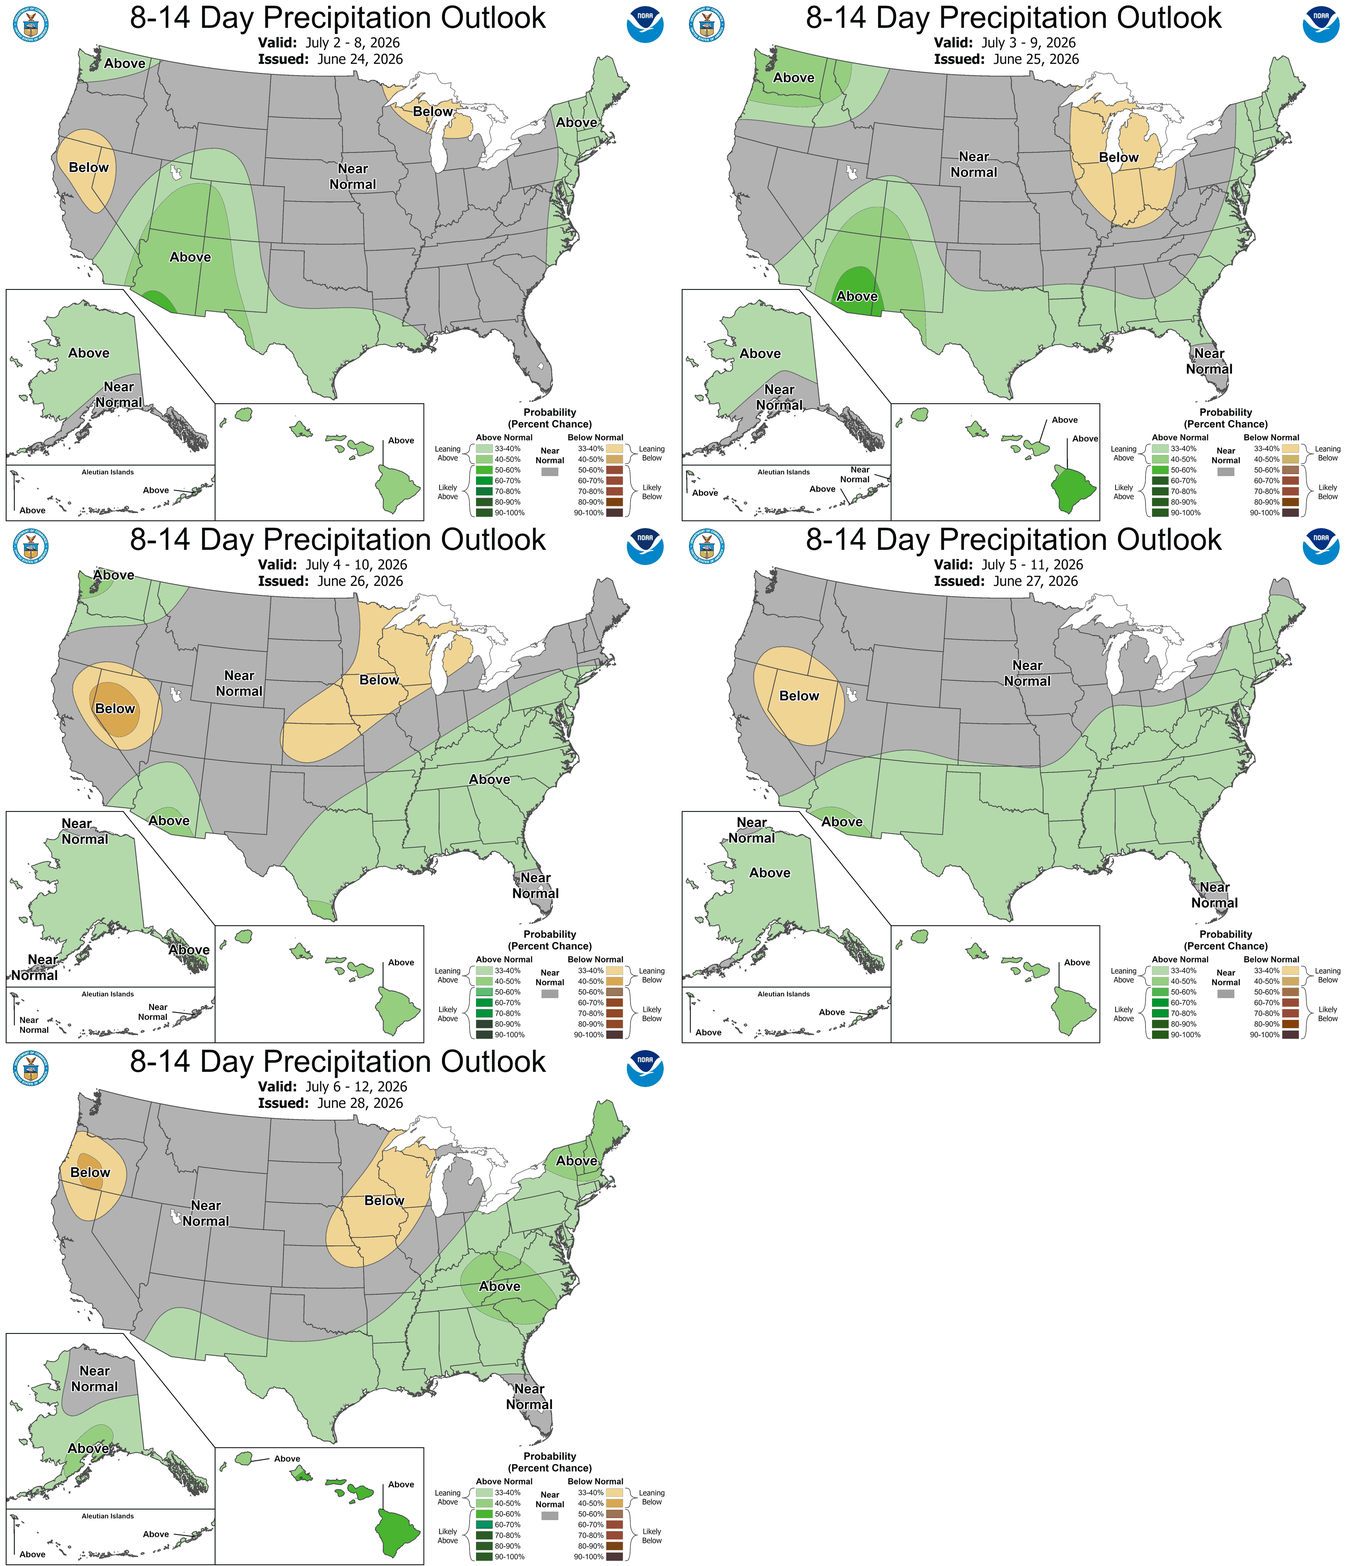
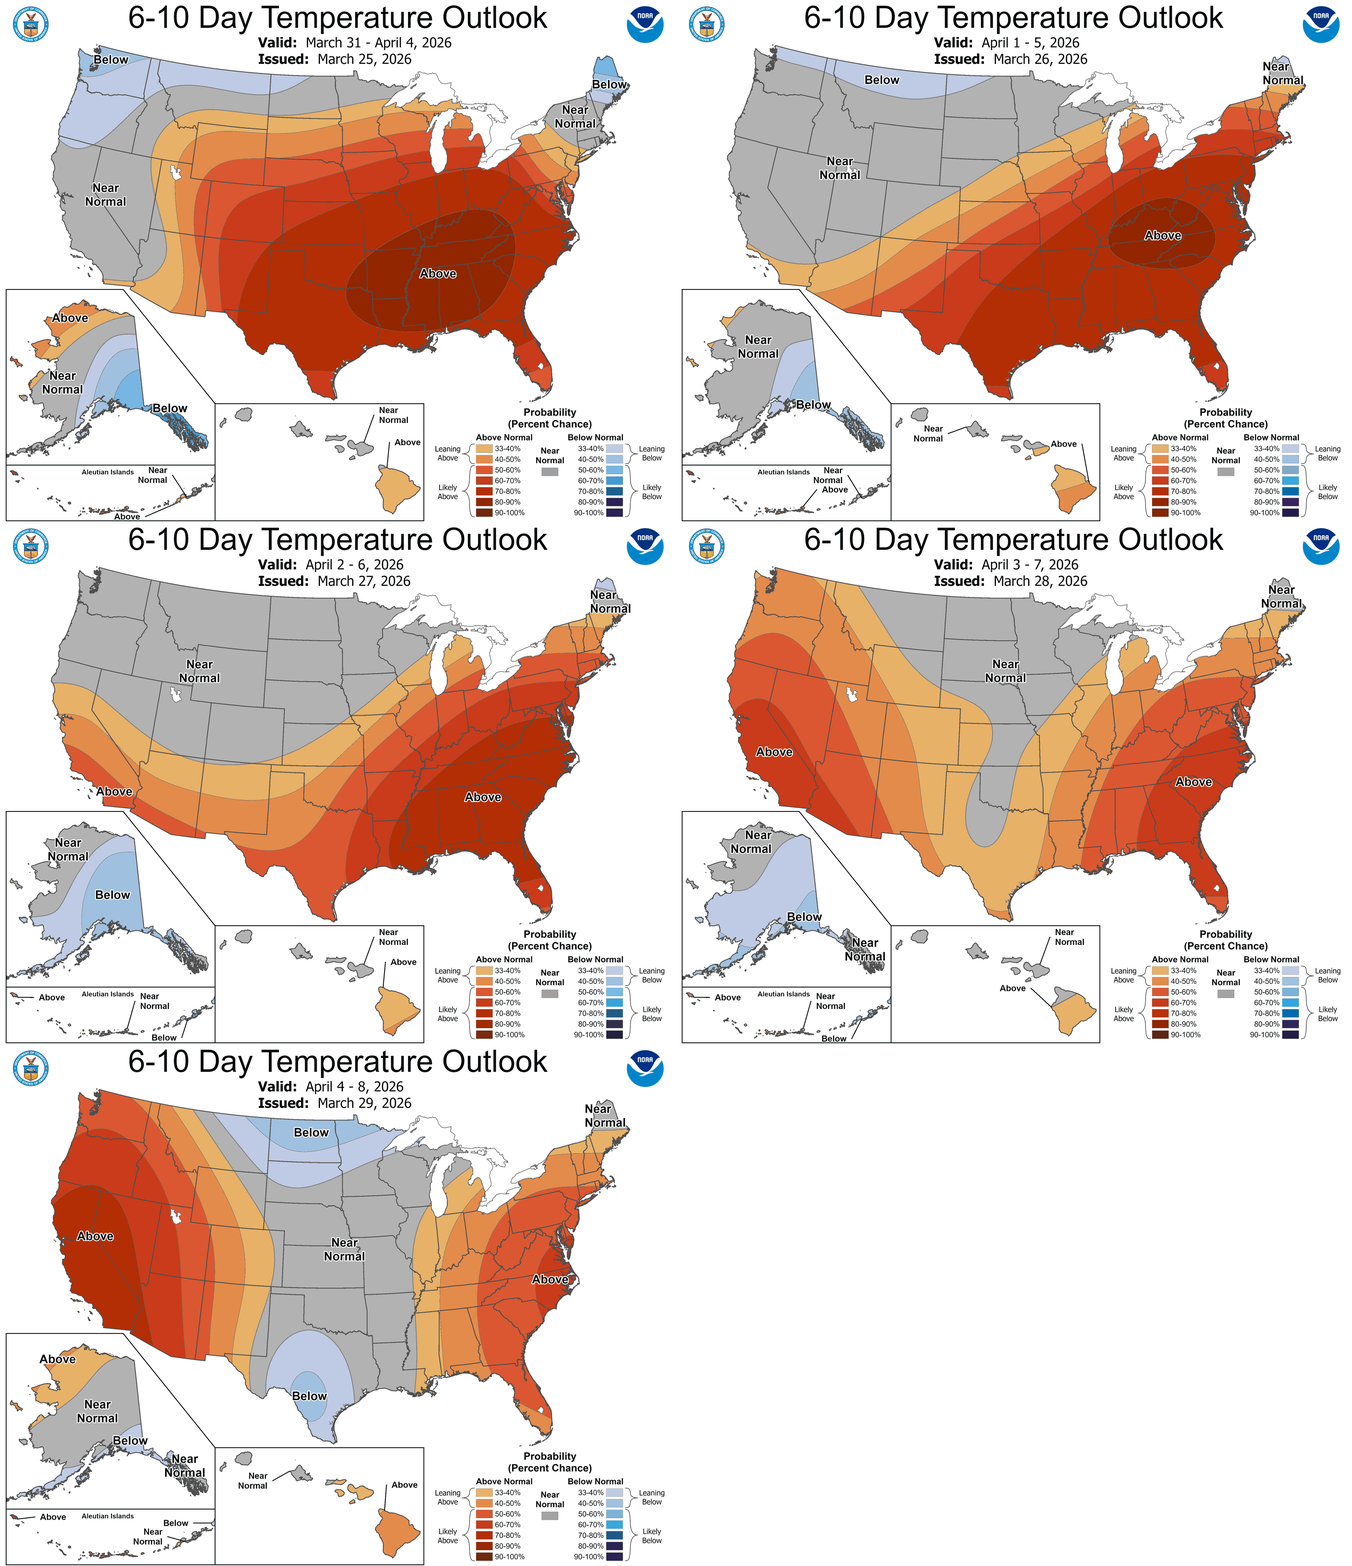
NOAA released updated precipitation and temperature outlooks as of July 9, 2026. 6-10 Day Outlooks 8-14 Day Outlooks Latest Drought Monitor Maps From July 7 , 2026 — PAST PERFORMANCE IS NOT INDICATIVE OF FUTURE RESULTS. FUTURES TRADING INVOLVES SUBSTANTIAL RISK AND IS NOT SUITABLE FOR ALL INVESTORS.
Written by
·
-

June 30, 2026, NOAA Weather Outlooks
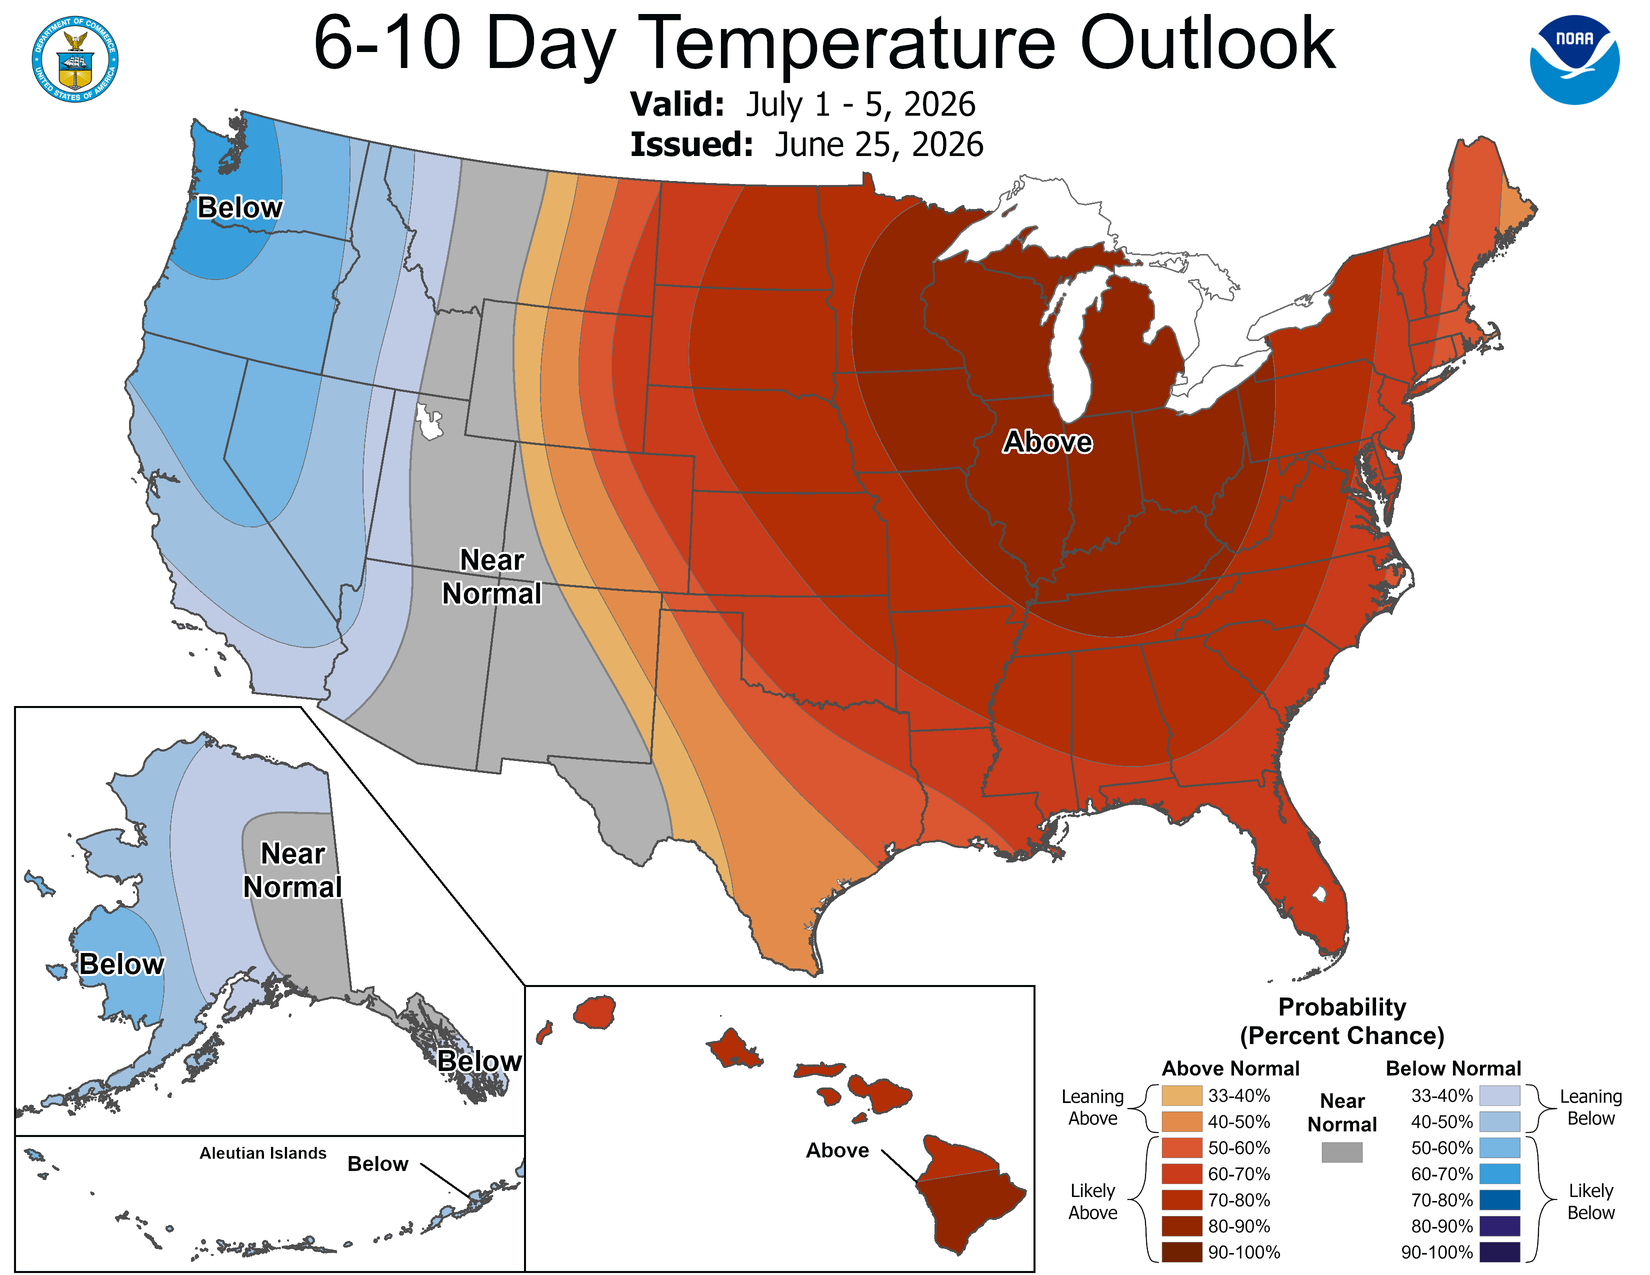
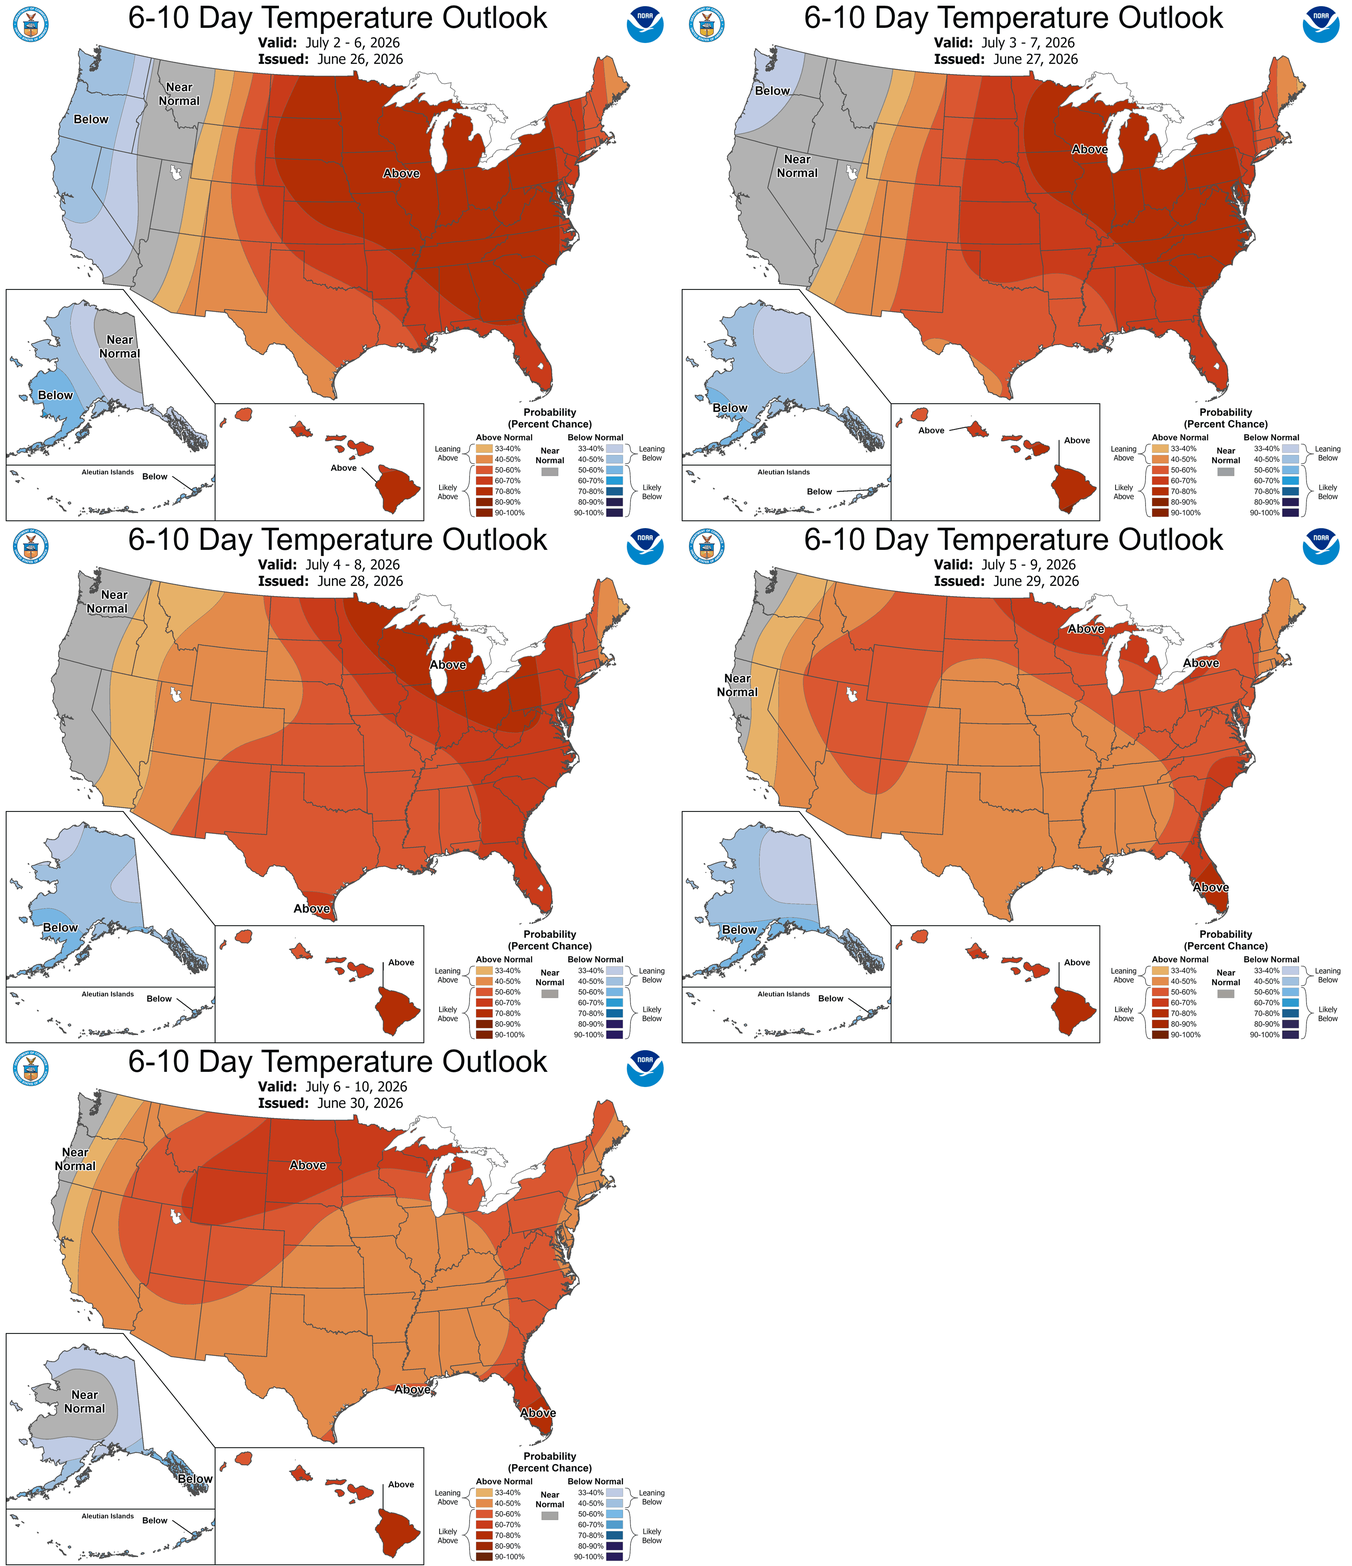
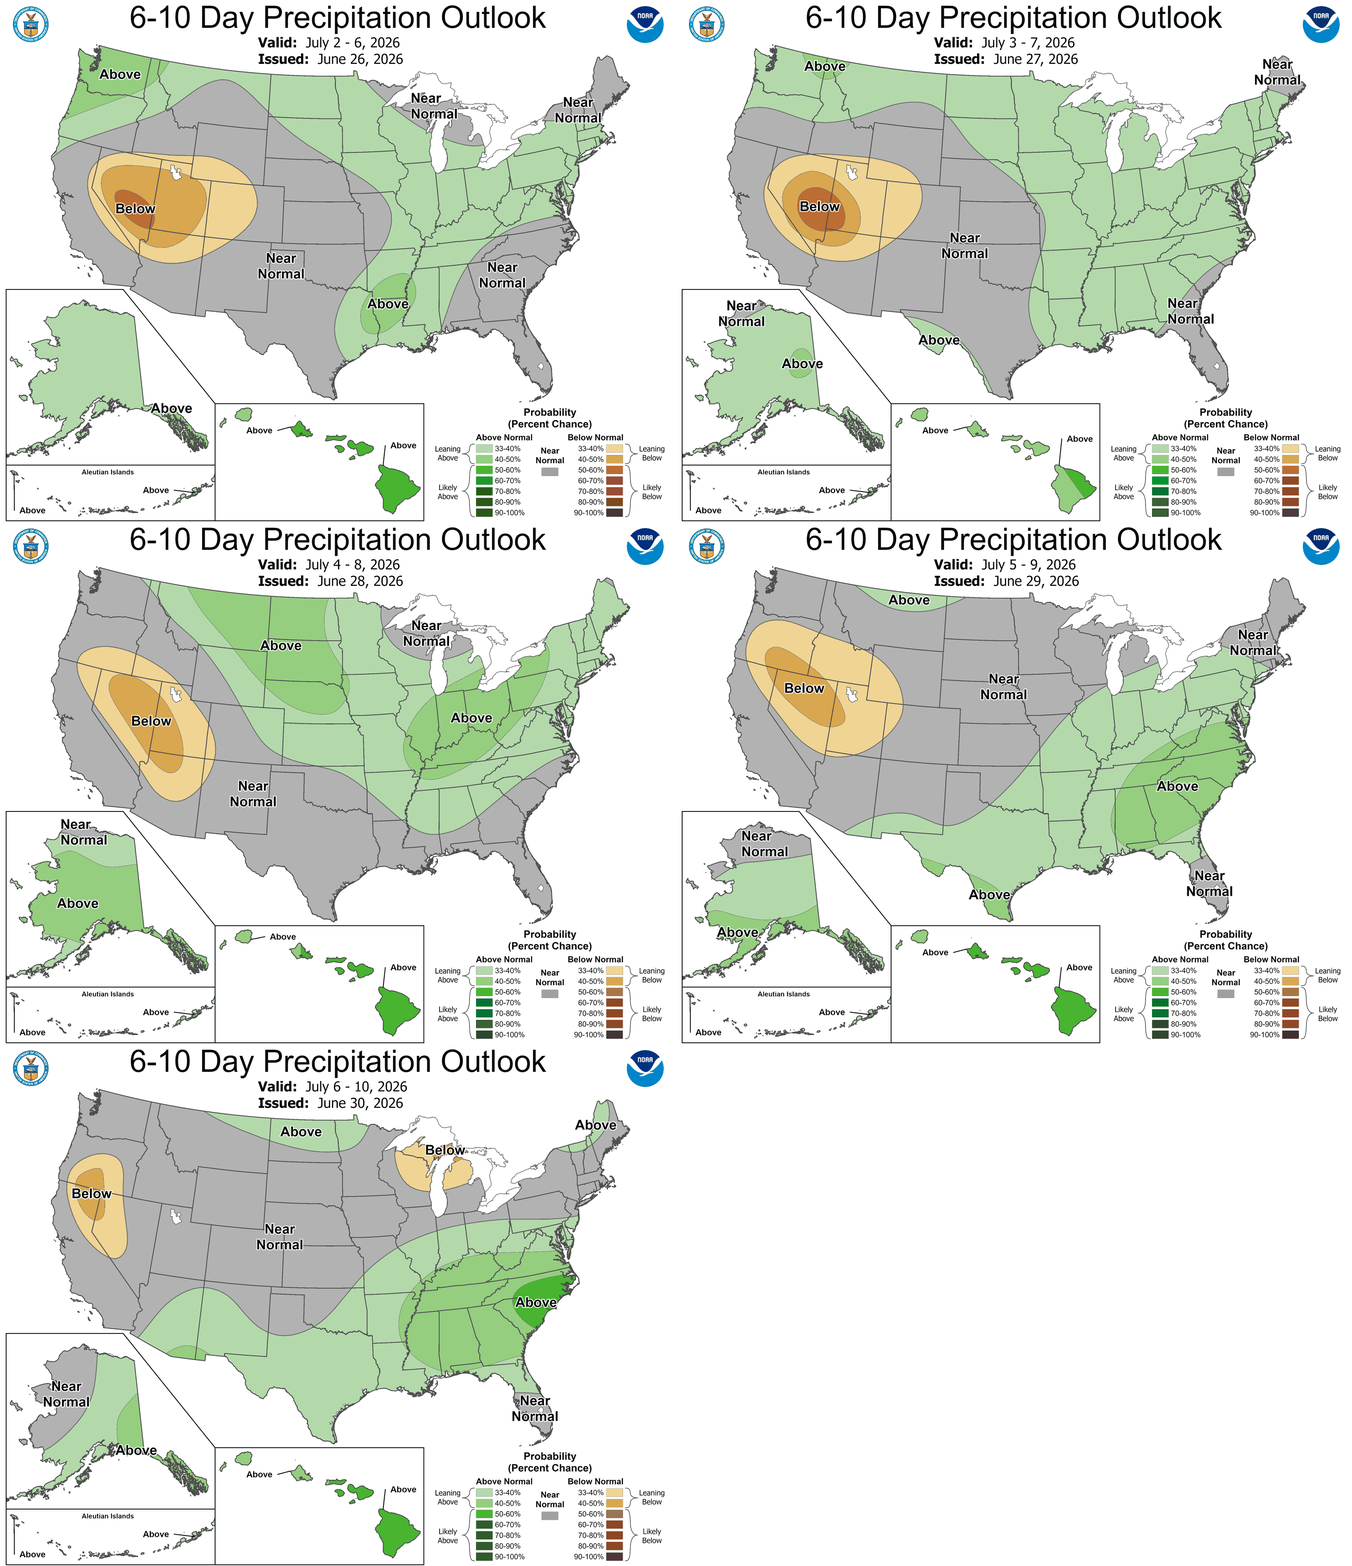
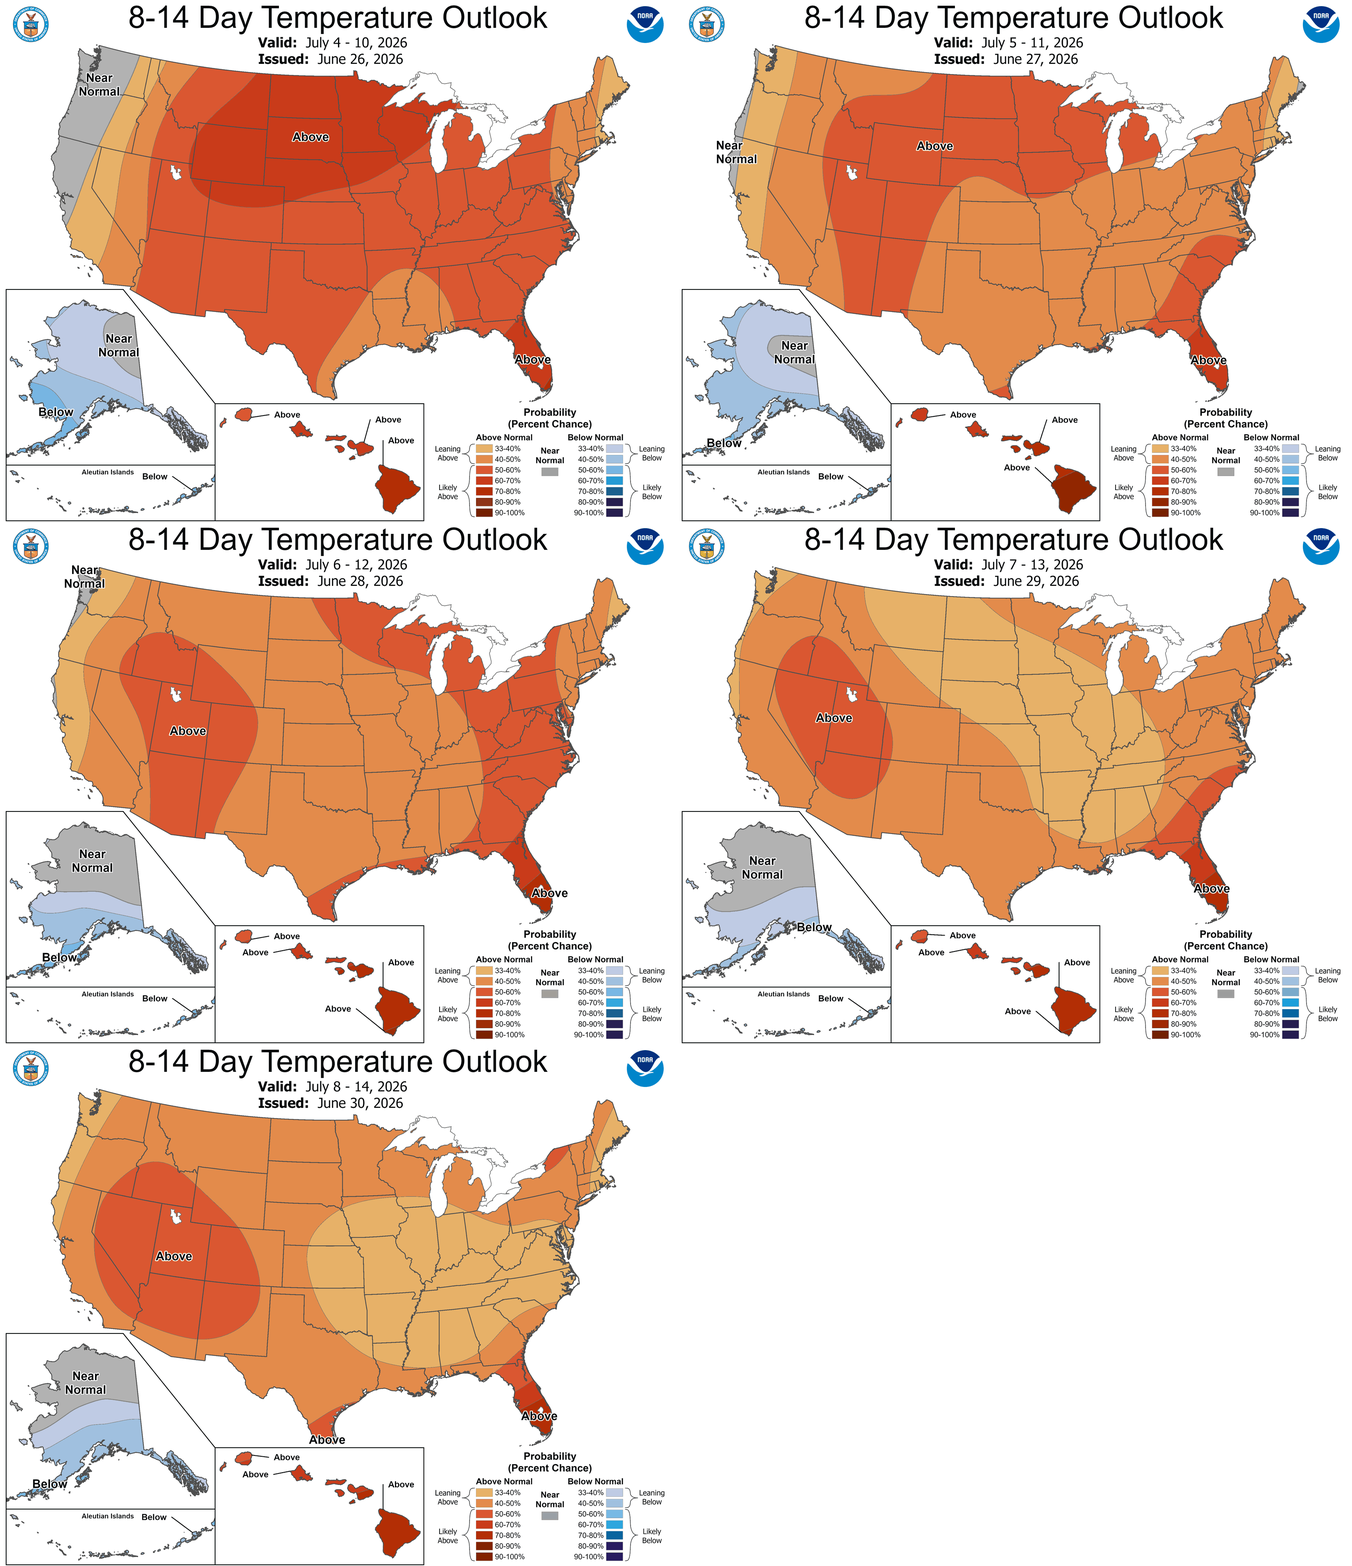
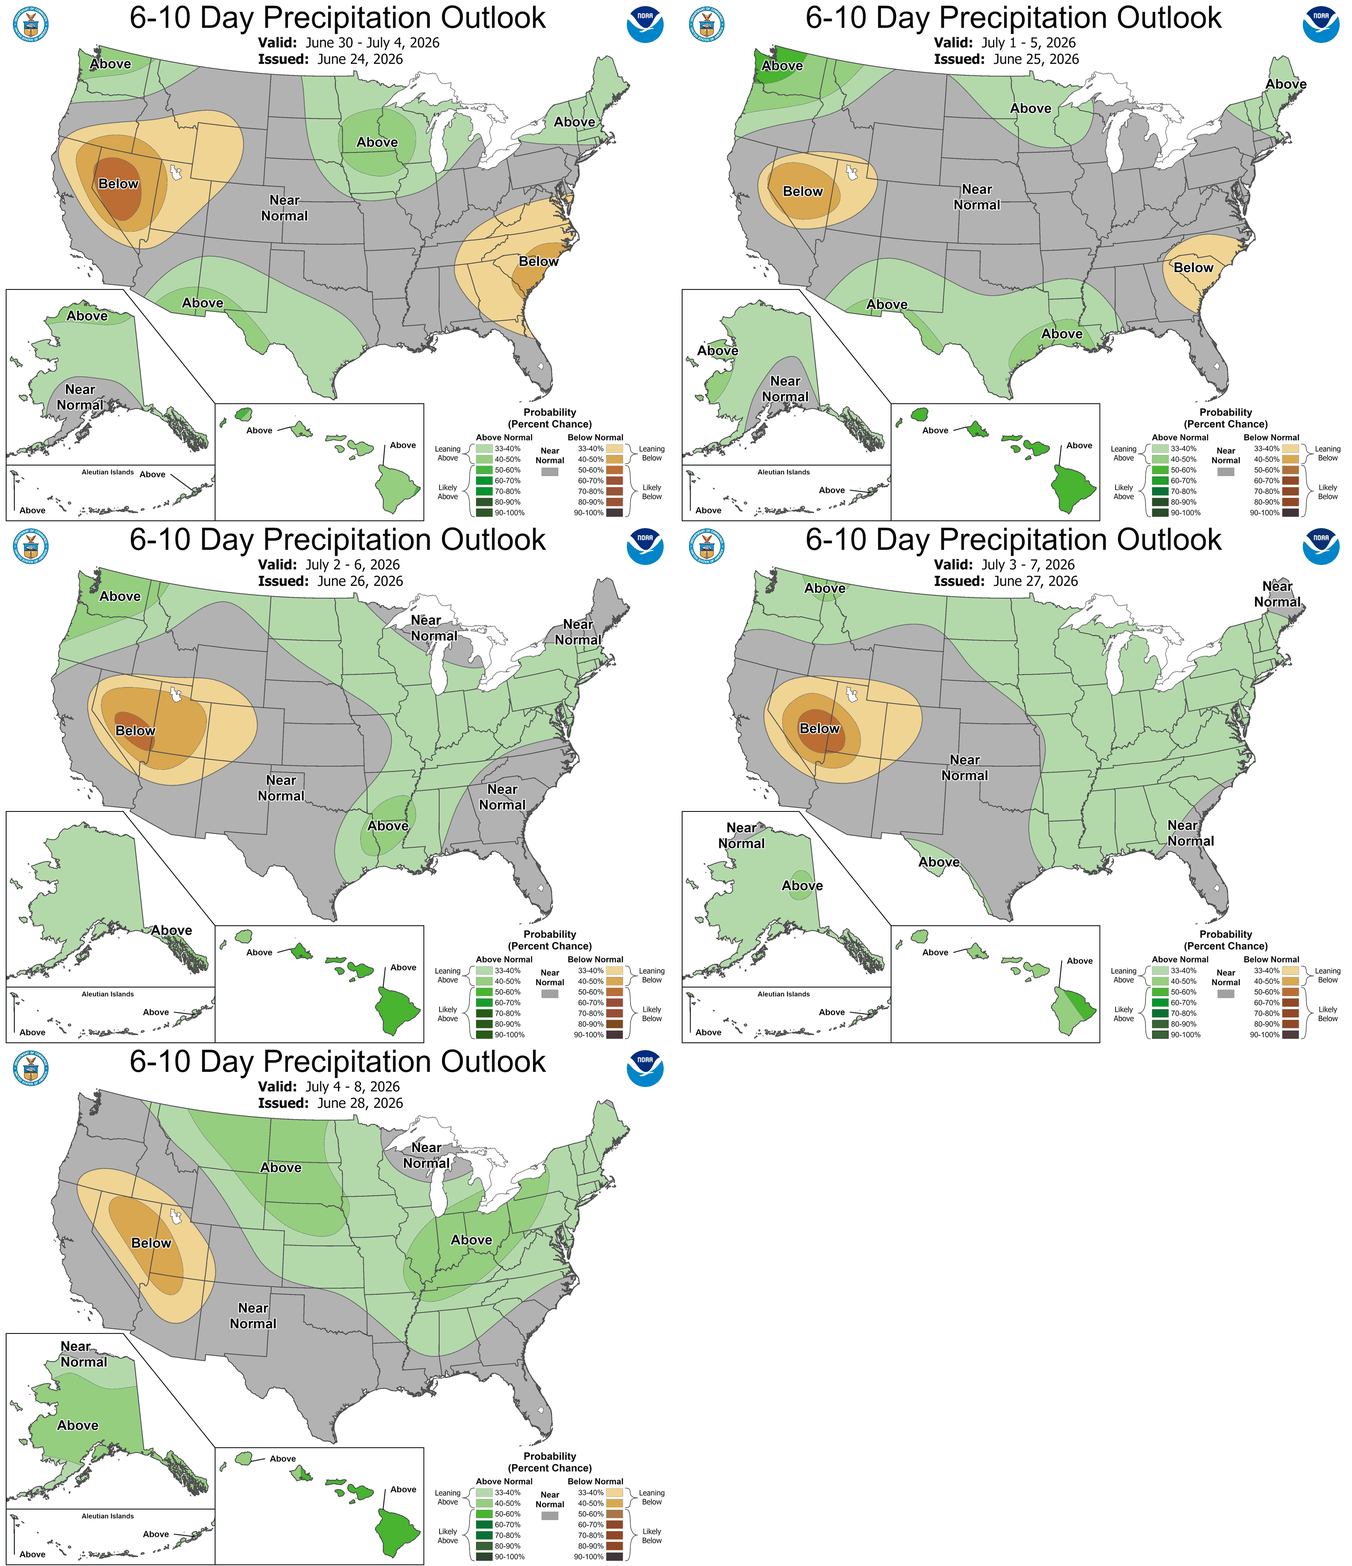
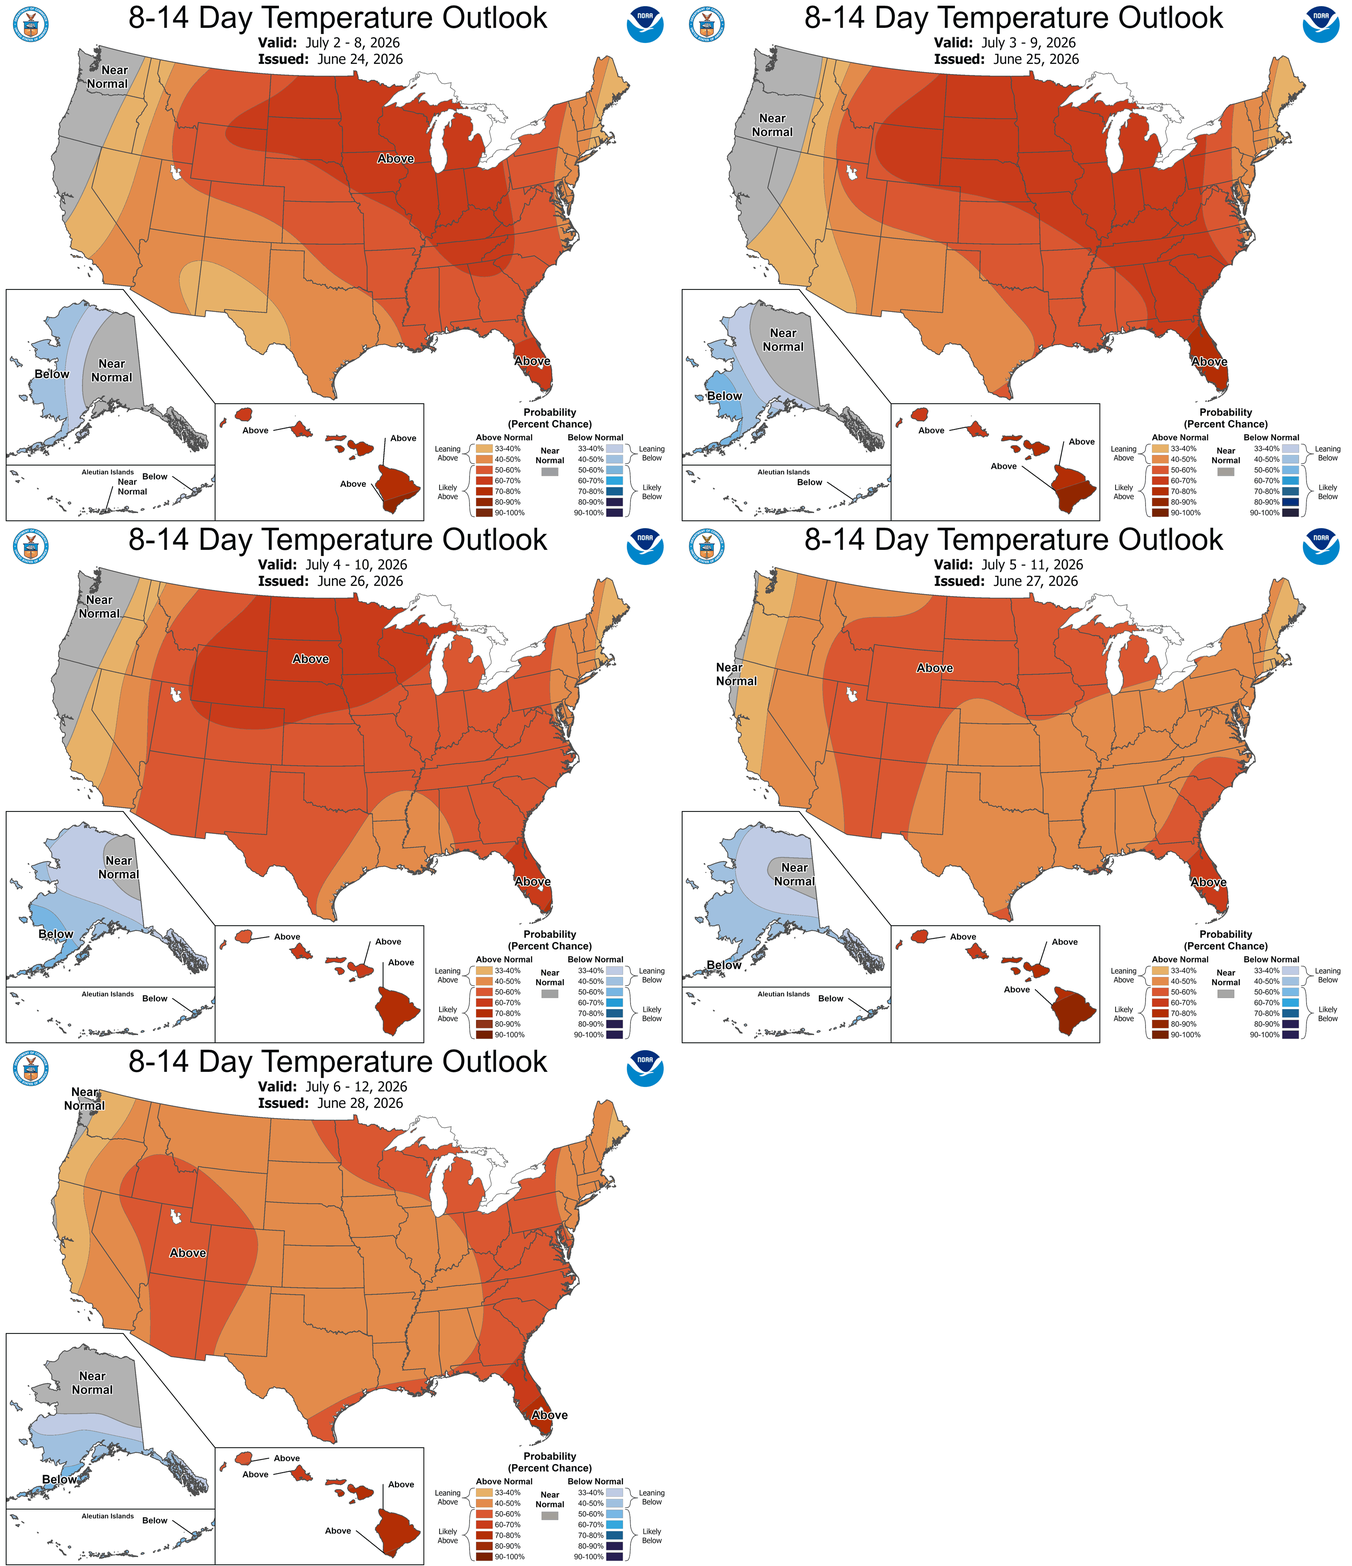
NOAA released updated precipitation and temperature outlooks as of June 30, 2026. 6-10 Day Outlooks 8-14 Day Outlooks Latest Drought Monitor Maps From June 23, 2026 — PAST PERFORMANCE IS NOT INDICATIVE OF FUTURE RESULTS. FUTURES TRADING INVOLVES SUBSTANTIAL RISK AND IS NOT SUITABLE FOR ALL INVESTORS.
Written by
·
-

June 29, 2026, NOAA Weather Outlooks
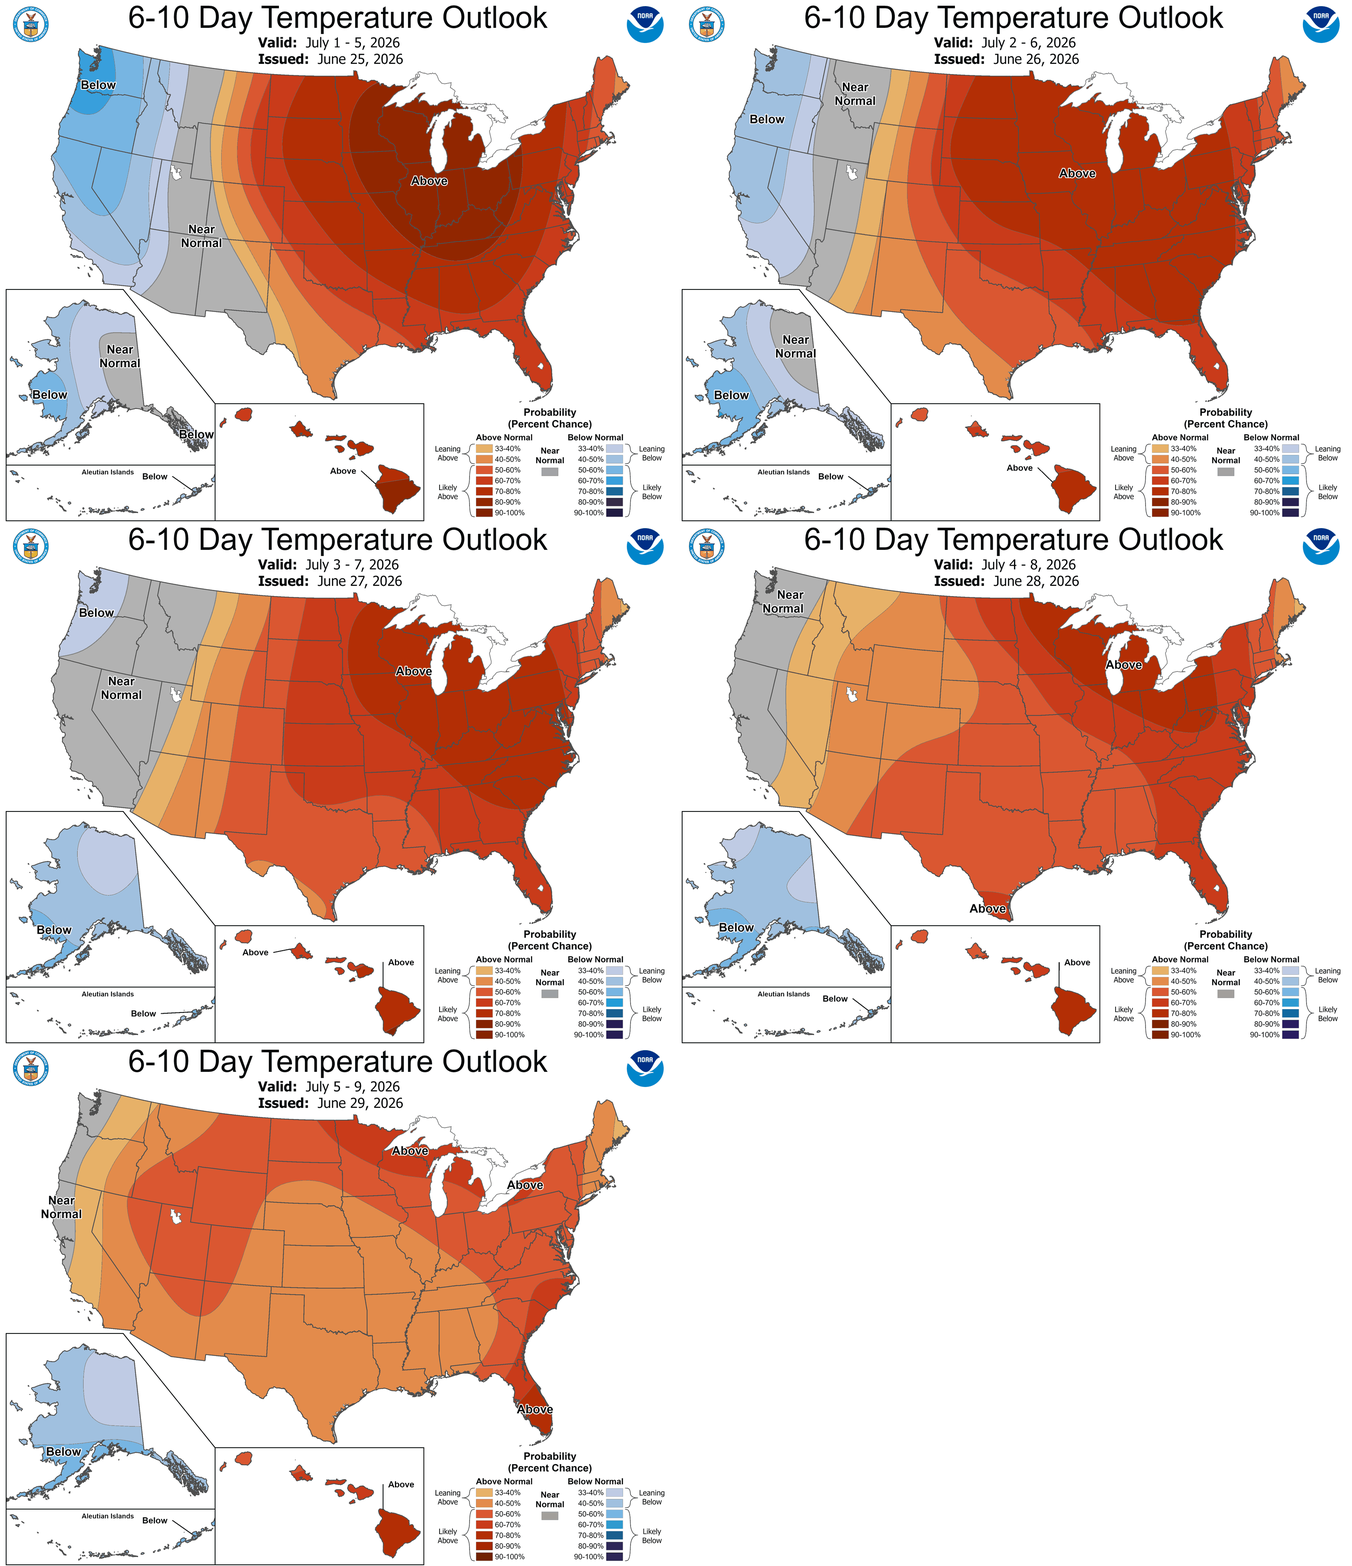
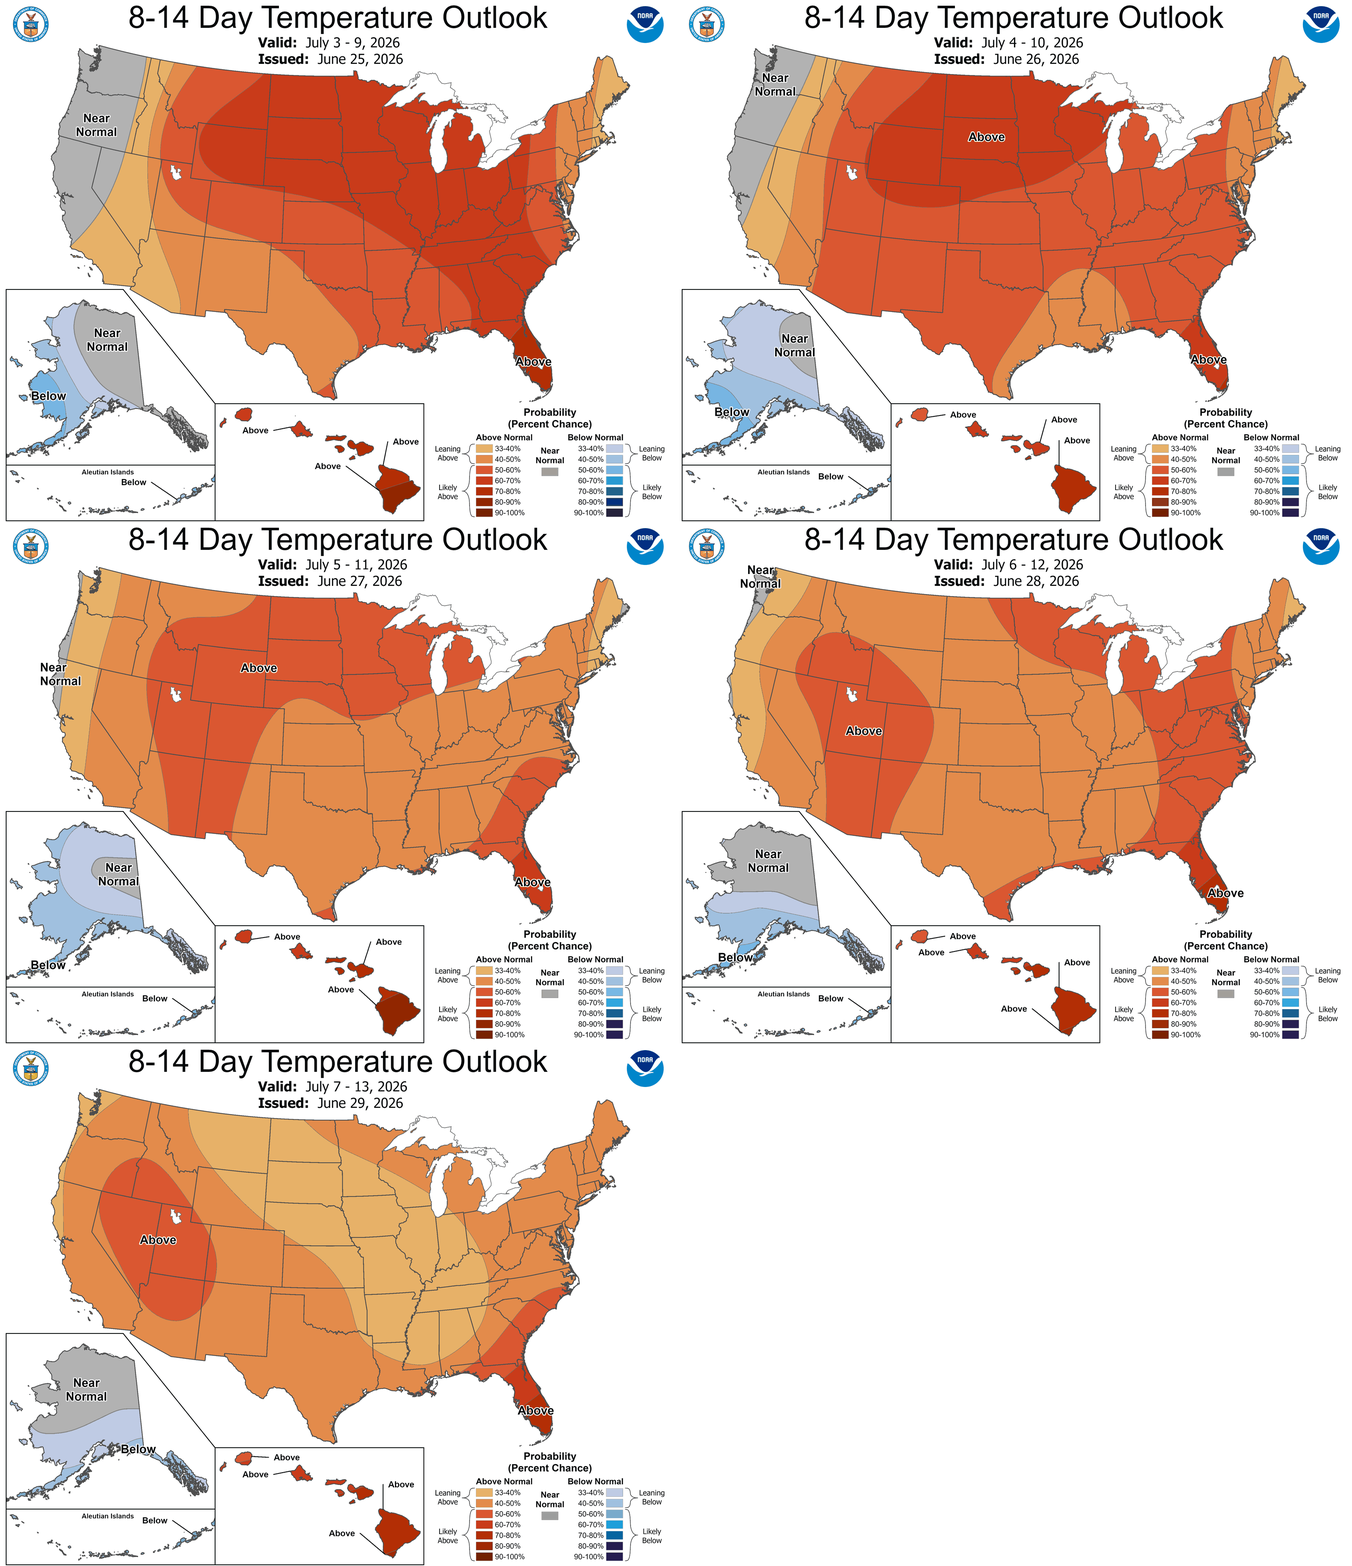
NOAA released updated precipitation and temperature outlooks as of June 29, 2026. 6-10 Day Outlooks 8-14 Day Outlooks Latest Drought Monitor Maps From June 23, 2026 — PAST PERFORMANCE IS NOT INDICATIVE OF FUTURE RESULTS. FUTURES TRADING INVOLVES SUBSTANTIAL RISK AND IS NOT SUITABLE FOR ALL INVESTORS.
Written by
·
-

June 28, 2026, NOAA Weather Outlooks
NOAA released updated precipitation and temperature outlooks as of June 28, 2026. 6-10 Day Outlooks 8-14 Day Outlooks Latest Drought Monitor Maps From June 23, 2026 — PAST PERFORMANCE IS NOT INDICATIVE OF FUTURE RESULTS. FUTURES TRADING INVOLVES SUBSTANTIAL RISK AND IS NOT SUITABLE FOR ALL INVESTORS.
Written by
·
-

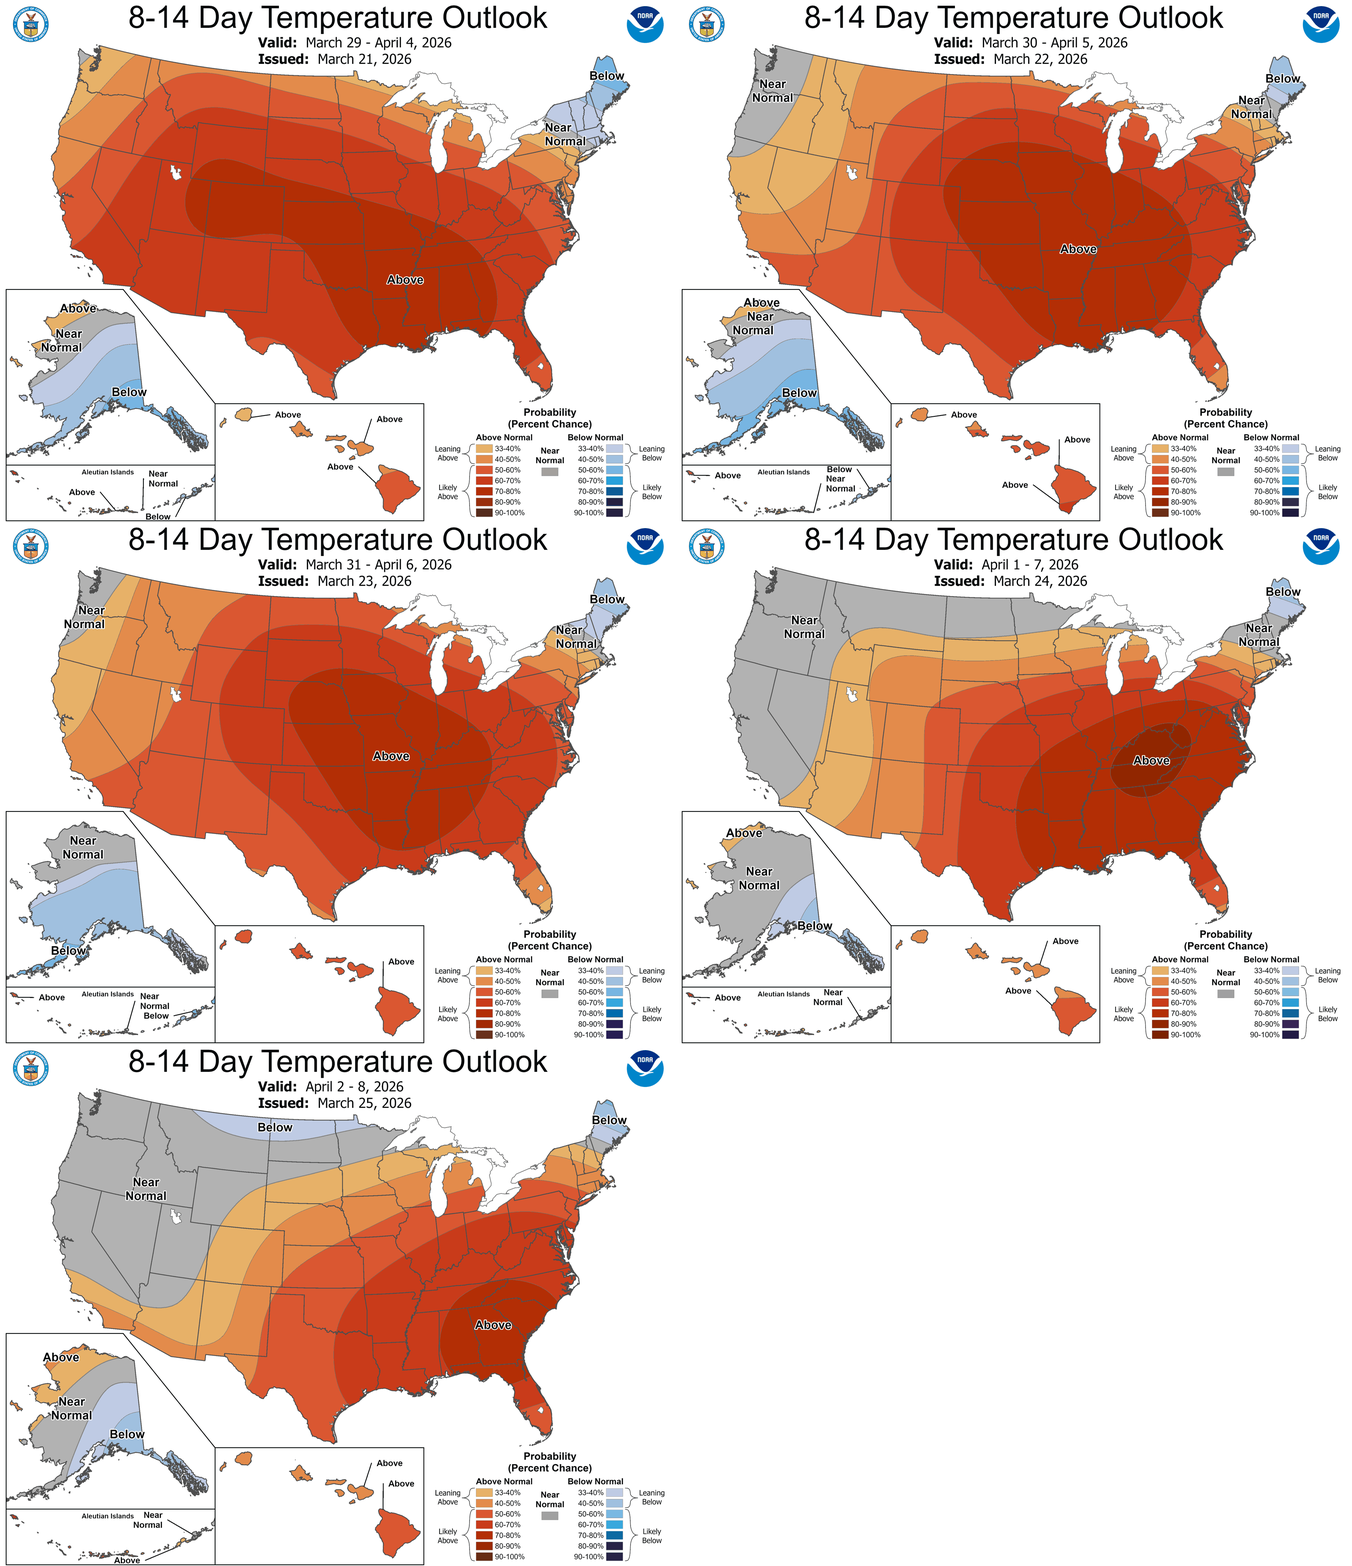
March 29, 2026, NOAA Weather Outlooks
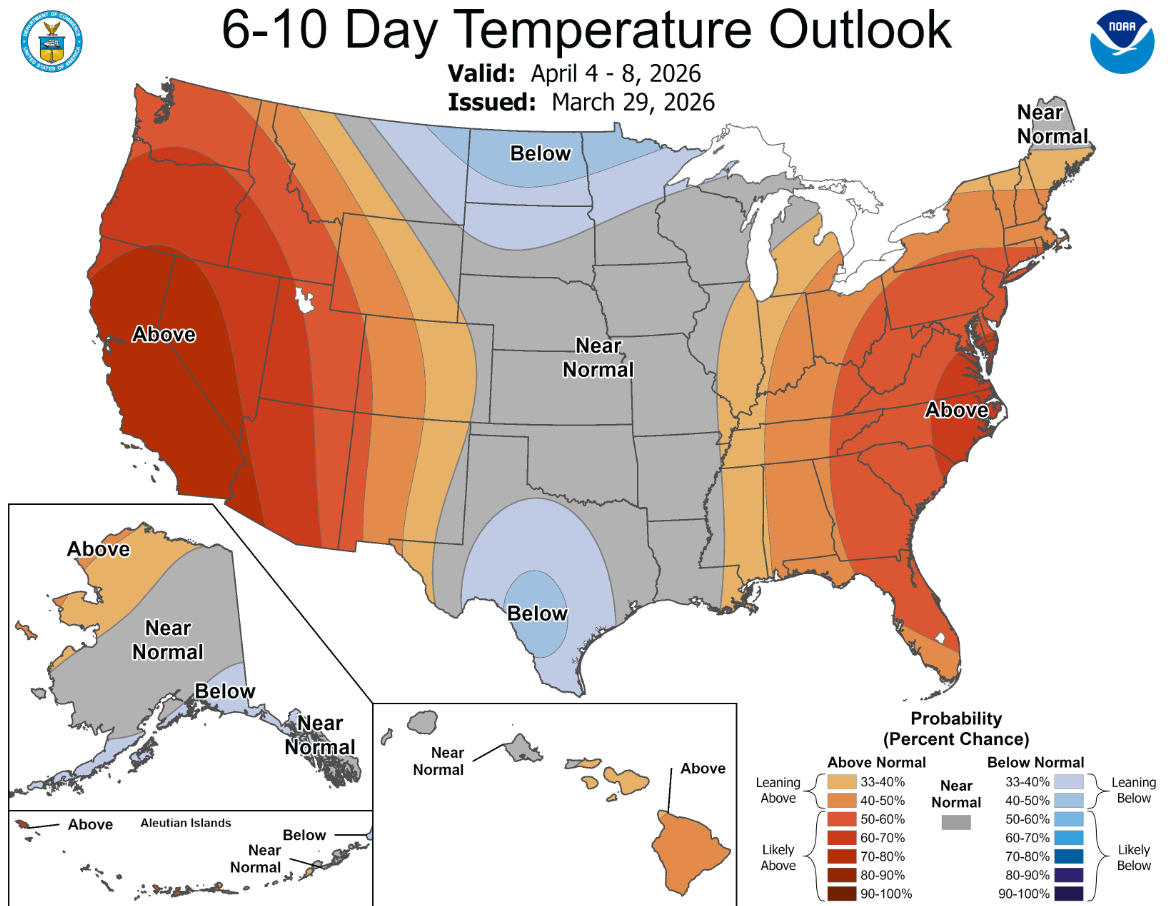
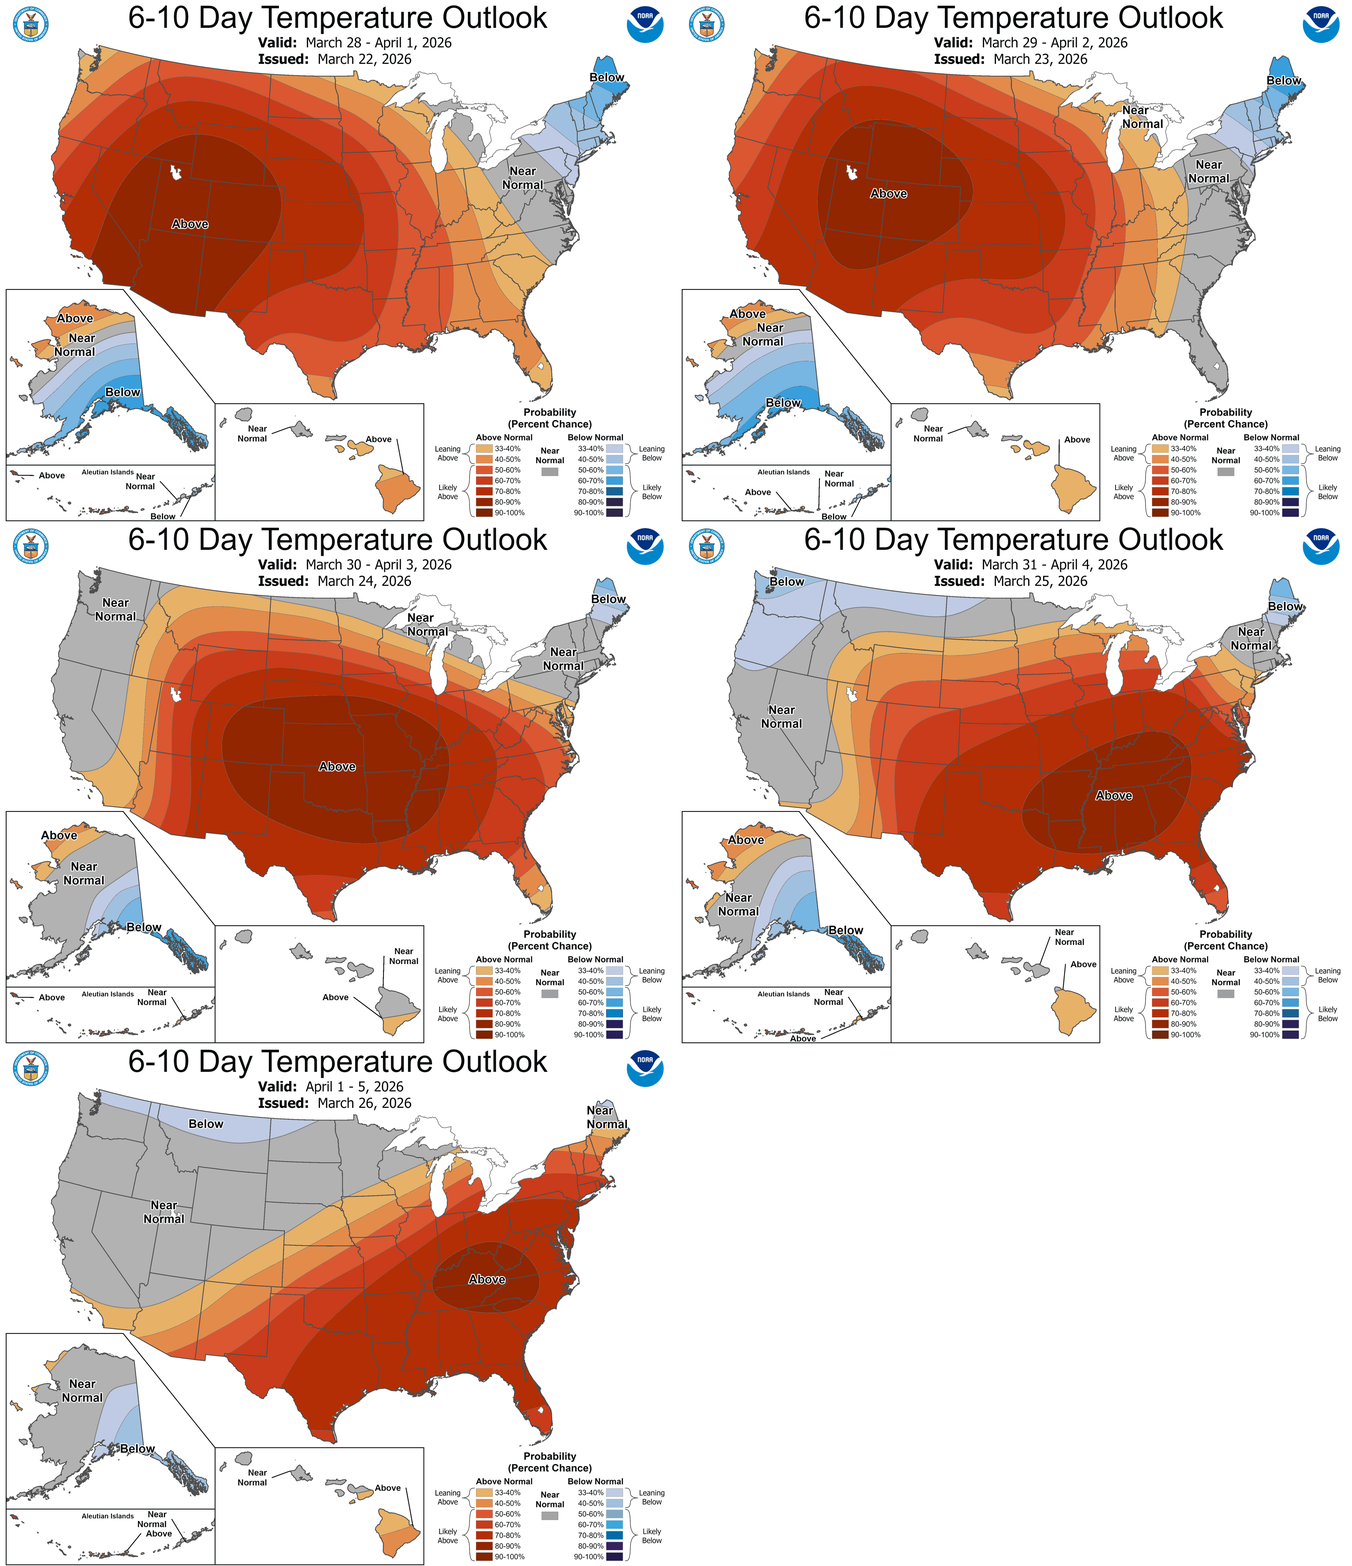
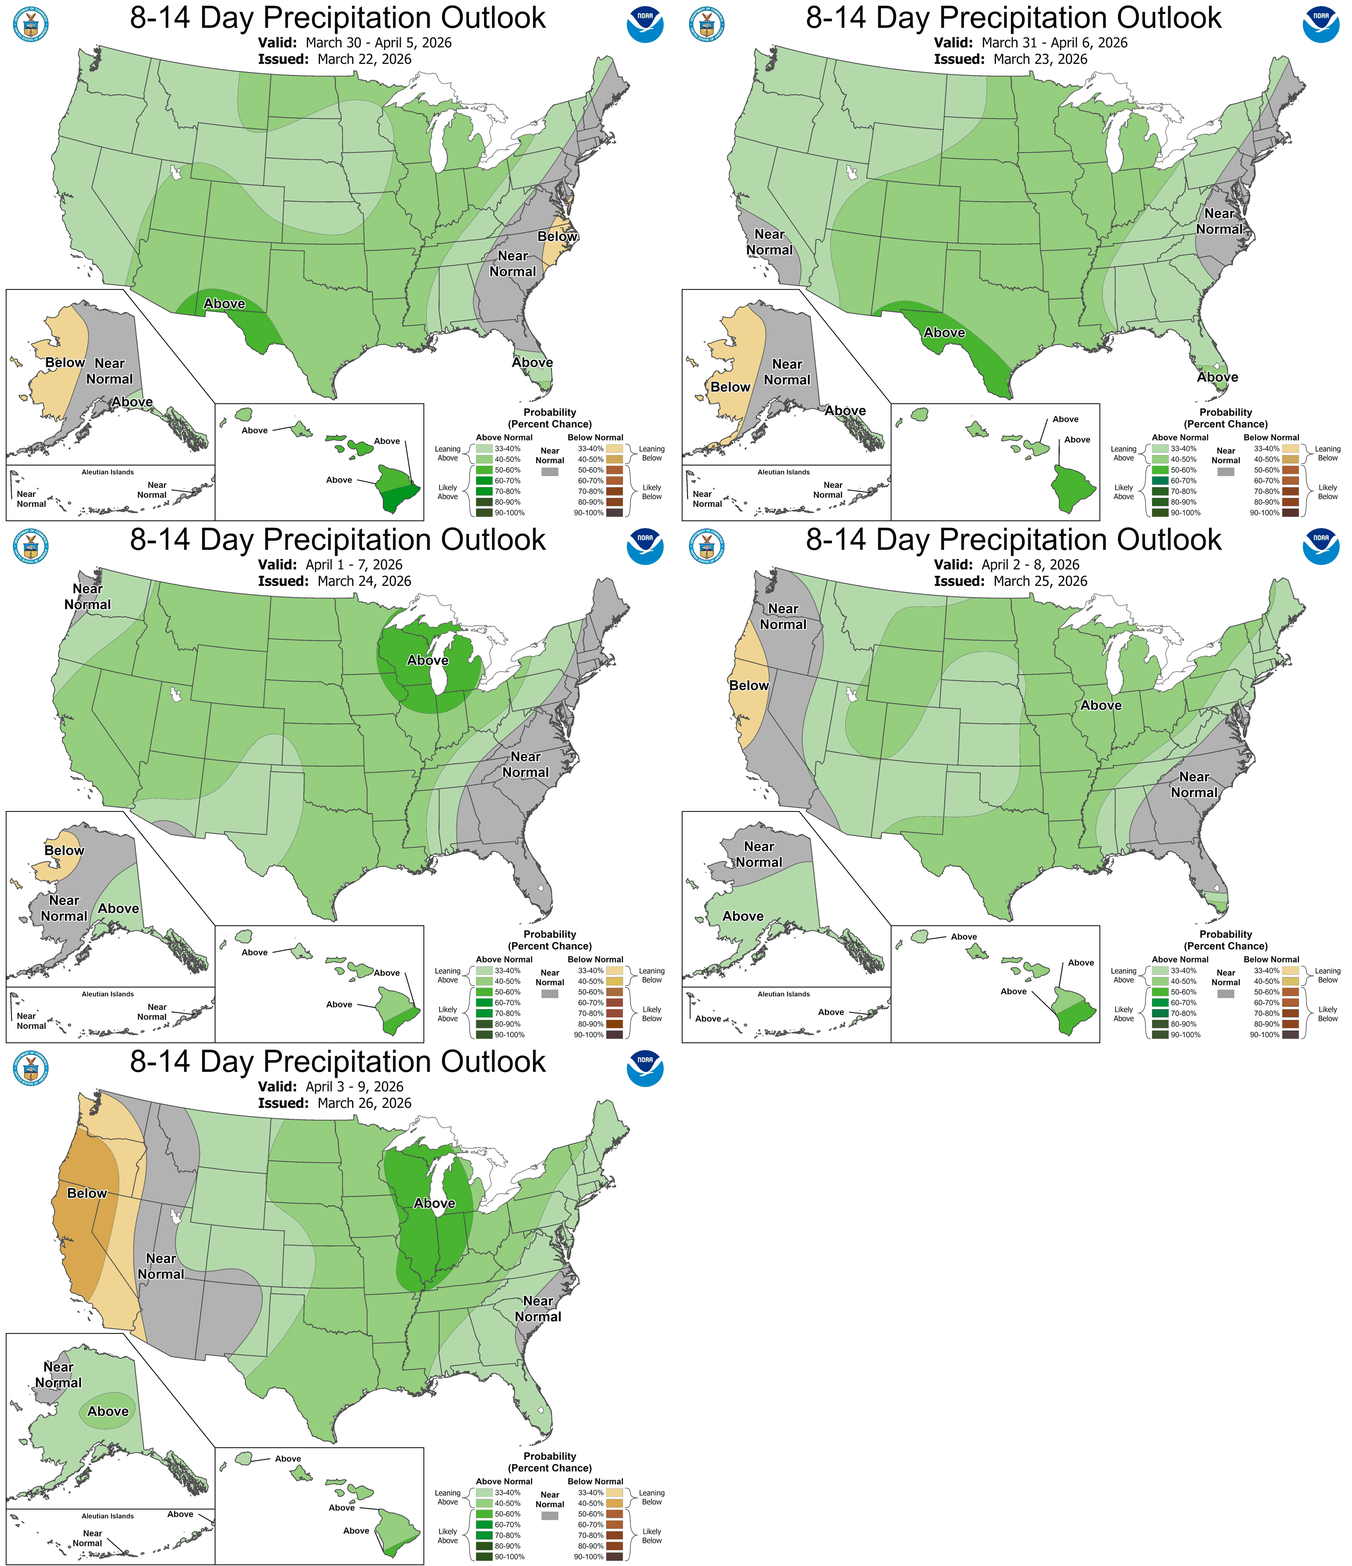
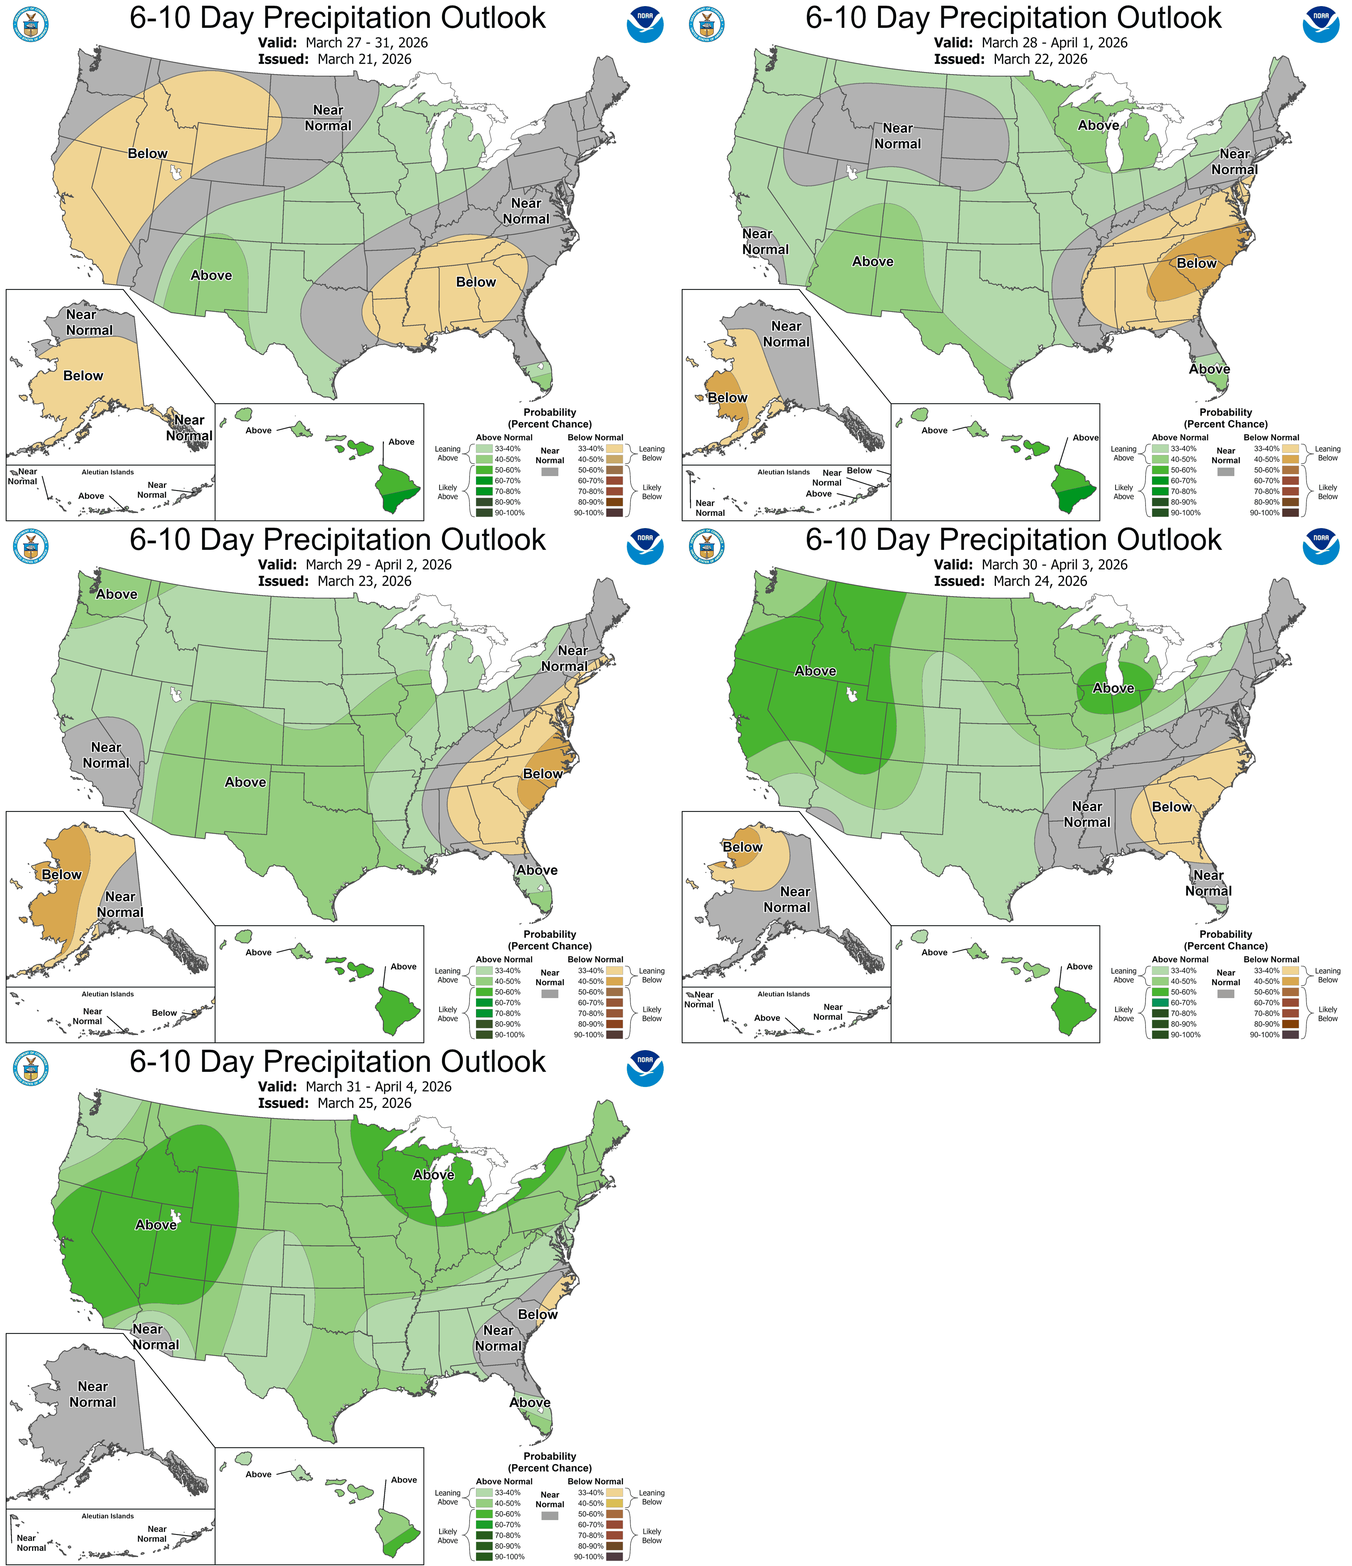
NOAA released updated precipitation and temperature outlooks as of March 29, 2026. 6-10 Day Outlooks 8-14 Day Outlooks Latest Drought Monitor Maps From March 24, 2026 — PAST PERFORMANCE IS NOT INDICATIVE OF FUTURE RESULTS. FUTURES TRADING INVOLVES SUBSTANTIAL RISK AND IS NOT SUITABLE FOR ALL INVESTORS.
Written by
·
NOAA released updated precipitation and temperature outlooks as of March 29, 2026.
6-10 Day Outlooks


8-14 Day Outlooks


Latest Drought Monitor Maps From March 24, 2026


—
PAST PERFORMANCE IS NOT INDICATIVE OF FUTURE RESULTS. FUTURES TRADING INVOLVES SUBSTANTIAL RISK AND IS NOT SUITABLE FOR ALL INVESTORS.
-

March 26, 2026, NOAA Weather Outlooks
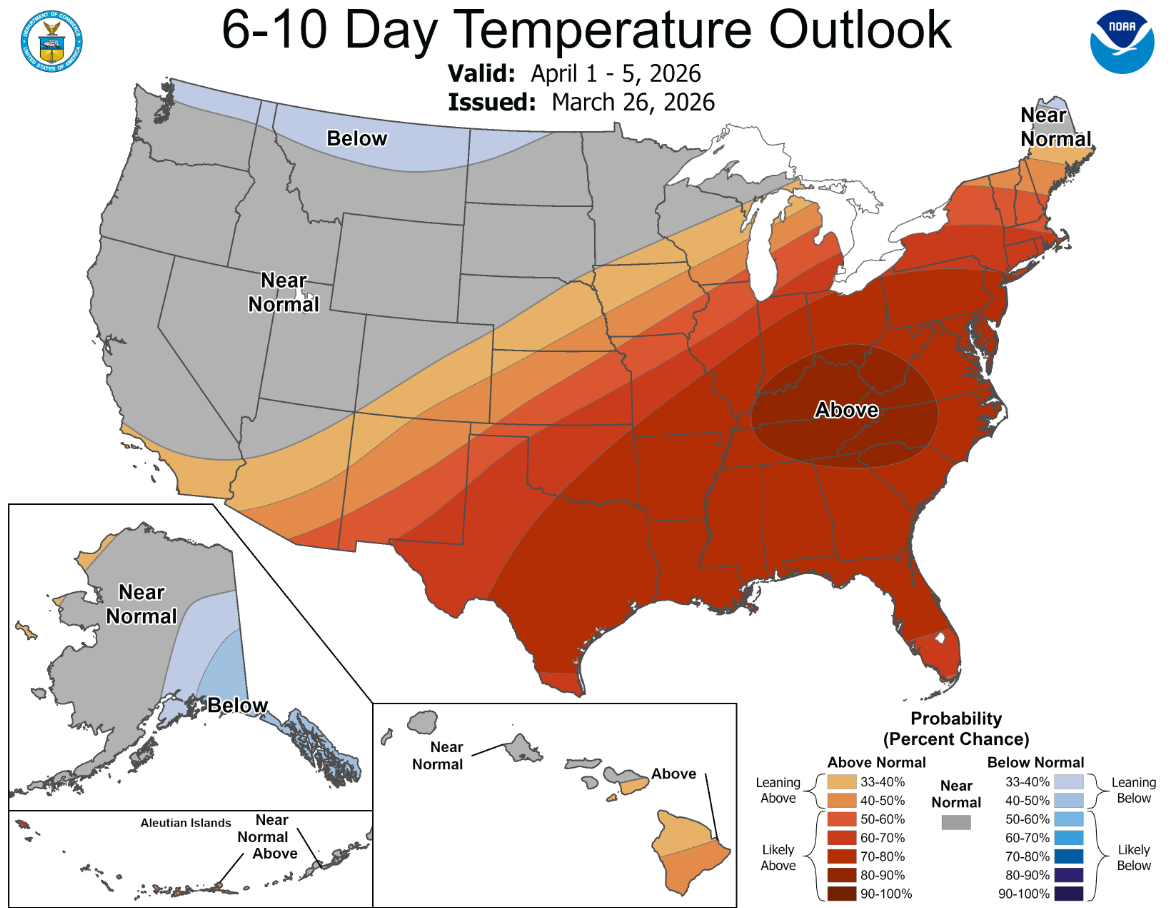
NOAA released updated precipitation and temperature outlooks as of March 26, 2026. 6-10 Day Outlooks 8-14 Day Outlooks Latest Drought Monitor Maps From March 24, 2026 — PAST PERFORMANCE IS NOT INDICATIVE OF FUTURE RESULTS. FUTURES TRADING INVOLVES SUBSTANTIAL RISK AND IS NOT SUITABLE FOR ALL INVESTORS.
Written by
·
NOAA released updated precipitation and temperature outlooks as of March 26, 2026.
6-10 Day Outlooks


8-14 Day Outlooks


Latest Drought Monitor Maps From March 24, 2026


—
PAST PERFORMANCE IS NOT INDICATIVE OF FUTURE RESULTS. FUTURES TRADING INVOLVES SUBSTANTIAL RISK AND IS NOT SUITABLE FOR ALL INVESTORS.
-

March 25, 2026, NOAA Weather Outlooks
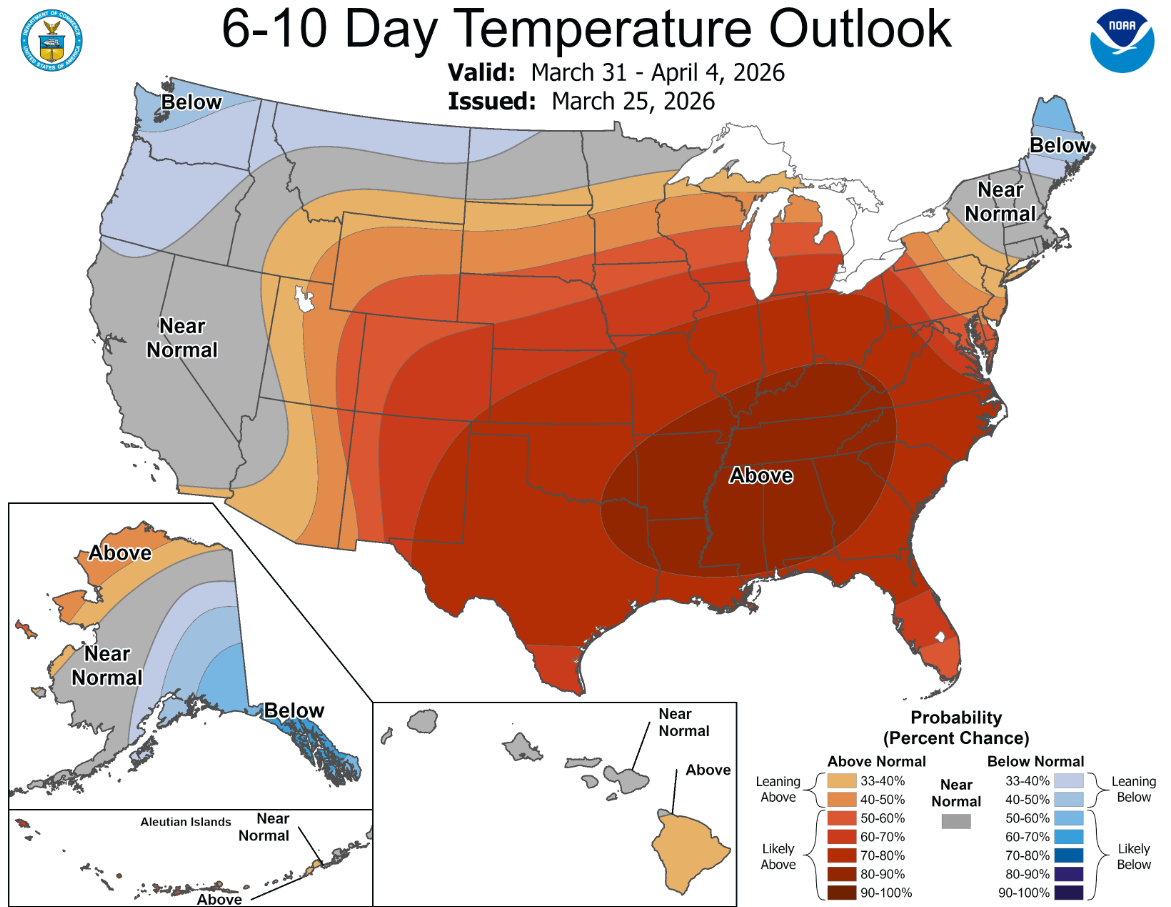
NOAA released updated precipitation and temperature outlooks as of March 25, 2026. 6-10 Day Outlooks 8-14 Day Outlooks Latest Drought Monitor Maps From March 24, 2026 — PAST PERFORMANCE IS NOT INDICATIVE OF FUTURE RESULTS. FUTURES TRADING INVOLVES SUBSTANTIAL RISK AND IS NOT SUITABLE FOR ALL INVESTORS.
Written by
·
NOAA released updated precipitation and temperature outlooks as of March 25, 2026.
6-10 Day Outlooks


8-14 Day Outlooks


Latest Drought Monitor Maps From March 24, 2026


—
PAST PERFORMANCE IS NOT INDICATIVE OF FUTURE RESULTS. FUTURES TRADING INVOLVES SUBSTANTIAL RISK AND IS NOT SUITABLE FOR ALL INVESTORS.
-

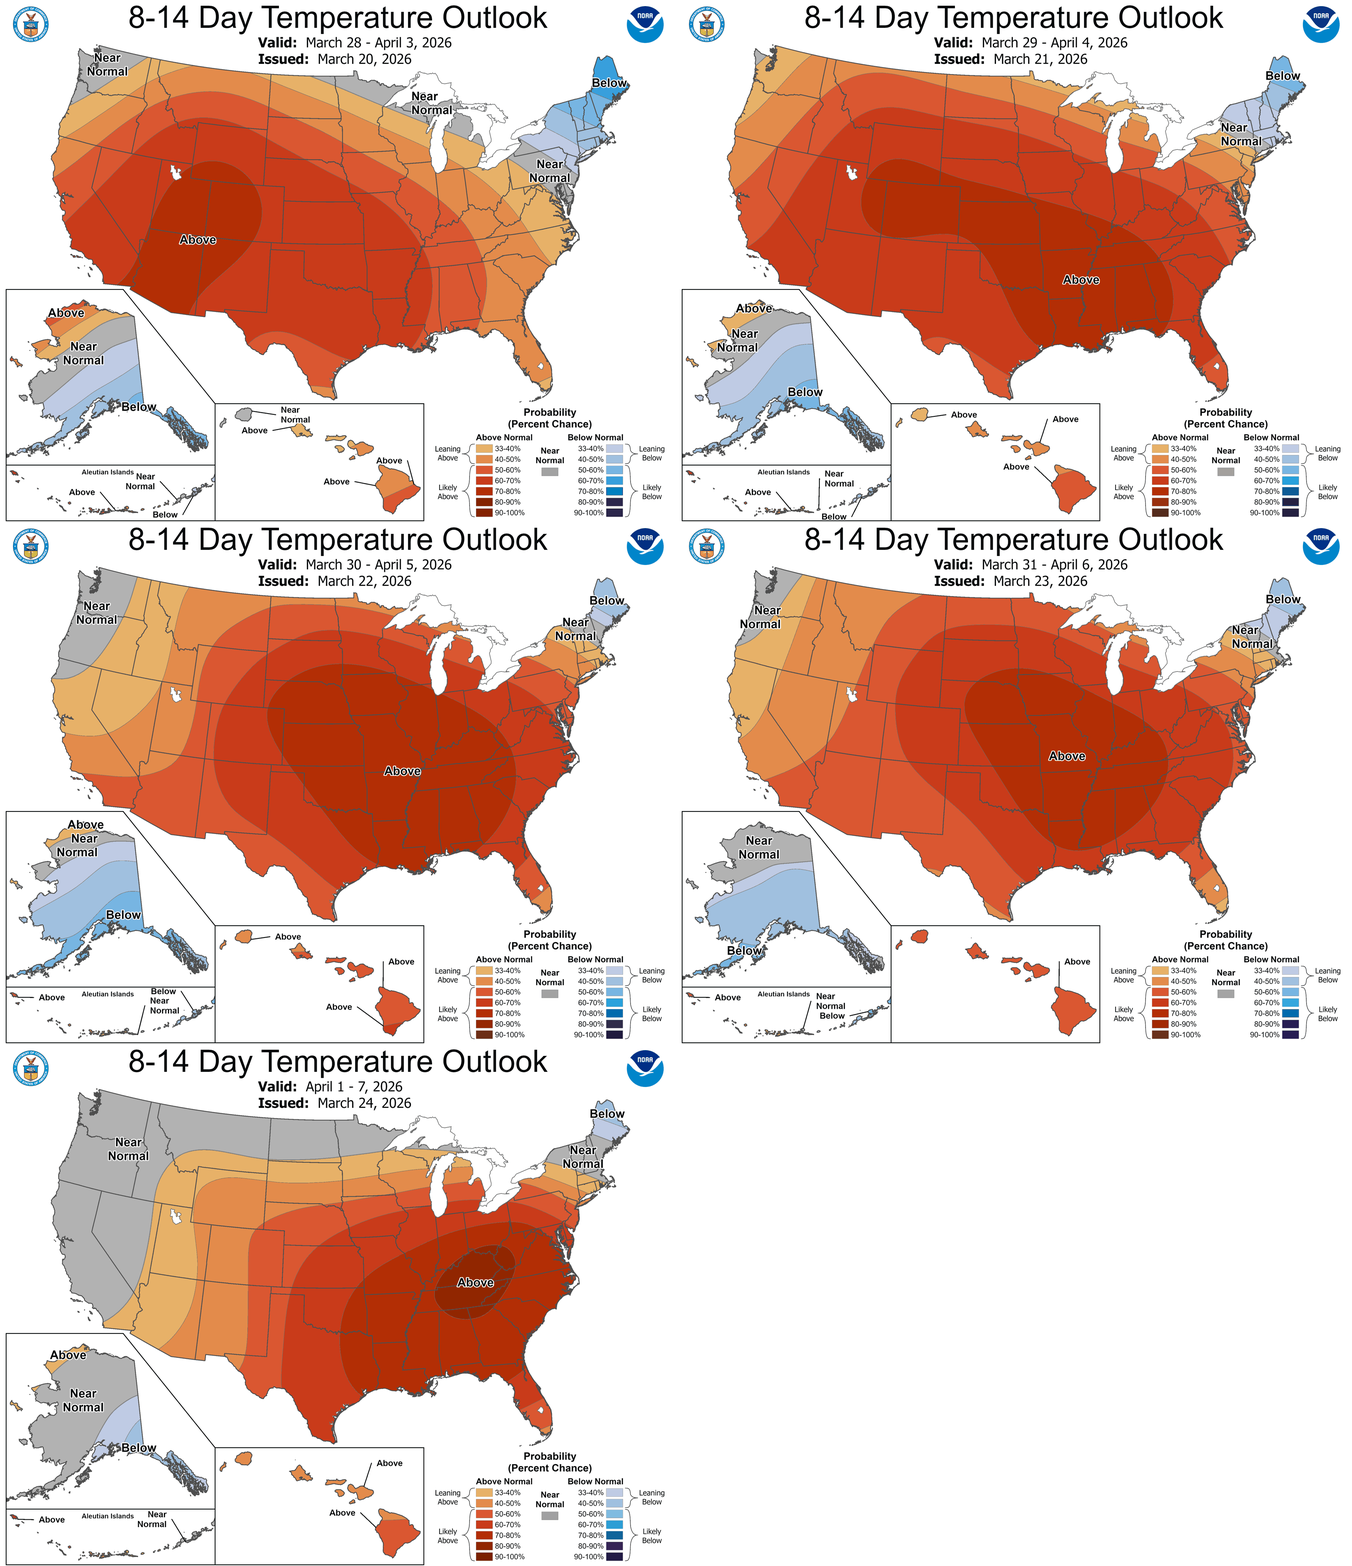
March 24, 2026, NOAA Weather Outlooks
NOAA released updated precipitation and temperature outlooks as of March 24, 2026. 6-10 Day Outlooks 8-14 Day Outlooks Latest Drought Monitor Maps From March 17, 2026 — PAST PERFORMANCE IS NOT INDICATIVE OF FUTURE RESULTS. FUTURES TRADING INVOLVES SUBSTANTIAL RISK AND IS NOT SUITABLE FOR ALL INVESTORS.
Written by
·
NOAA released updated precipitation and temperature outlooks as of March 24, 2026.
6-10 Day Outlooks


8-14 Day Outlooks


Latest Drought Monitor Maps From March 17, 2026


—
PAST PERFORMANCE IS NOT INDICATIVE OF FUTURE RESULTS. FUTURES TRADING INVOLVES SUBSTANTIAL RISK AND IS NOT SUITABLE FOR ALL INVESTORS.
-

U.S. corn, soybean, and wheat export sales dipped in the week ending March 12
U.S. corn, soybean, and wheat export sales dipped last week, according to the USDA’s weekly export sales report. During the week ending March 12, corn sales dipped 22.7 percent to 1.17 million metric tons (MMT) for the 2025/26 marketing year. Mexico was the top buyer, followed by Japan and Spain. Total net sales of 12,000…
Written by
·
U.S. corn, soybean, and wheat export sales dipped last week, according to the USDA’s weekly export sales report. During the week ending March 12, corn sales dipped 22.7 percent to 1.17 million metric tons (MMT) for the 2025/26 marketing year. Mexico was the top buyer, followed by Japan and Spain. Total net sales of 12,000 metric tons (MT) for 2026/27 were for Japan.
Physical shipments were up 4 percent from the previous week at 1.75 MMT. Mexico was the No. 1 destination for U.S. corn during the week. Japan, Venezuela, Spain, and South Korea rounded out the top five. Total exports and commitments for the marketing year rose to 67.697 MMT, up 30 percent year-over-year.

U.S. soybean export sales of 298,200 MT for 2025/26 were down 35 percent from the previous week. China was the top buyer for the week. Mexico and unknown buyers were the next top destinations. Net sales of 6,600 MT for 2026/27 were reported for Japan and South Korea.
Weekly soybean exports fell nine percent from the previous week to 906,500 MT. About 60 percent of the shipments went to China. Egypt and Mexico also landed in the top five destinations. Total exports and commitments for the marketing year rose to 36.796 MMT, 19 percent lower than a year ago.

U.S. wheat export sales were down 58 percent to 189,900 MT for 2025/26 from the previous week. Mexico was the top buyer for the week, followed by the Philippines and South Korea. Net sales of 212,100 MT for 2026/27 were primarily for the Philippines, Mexico, South Korea, unknown destinations, and Jamaica.
Exports were down 11 percent for the week at 383,100 MT. Mexico was the top destination, followed by the Philippines, Bangladesh, South Korea, and the Dominican Republic. Total exports and commitments for the marketing year rose to 23.9 MMT, sitting 15 percent higher than a year ago.

—
PAST PERFORMANCE IS NOT INDICATIVE OF FUTURE RESULTS. FUTURES TRADING INVOLVES SUBSTANTIAL RISK AND IS NOT SUITABLE FOR ALL INVESTORS. -

Ethanol inventories rebound while production dips slightly
U.S. ethanol production dipped 2.9 percent last week to an average of 1.093 million barrels a day, according to the Energy Information Administration on Wednesday. Output was within the range of market expectations and 1 percent below the same week last year. The estimated corn crushed for ethanol was about 105.5 million bushels. Cumulative crushings…
Written by
·
U.S. ethanol production dipped 2.9 percent last week to an average of 1.093 million barrels a day, according to the Energy Information Administration on Wednesday. Output was within the range of market expectations and 1 percent below the same week last year.

The estimated corn crushed for ethanol was about 105.5 million bushels. Cumulative crushings for the marketing year rose to approximately 3.001 billion bushels, reaching about 54 percent of the USDA’s target.
Ethanol inventories rose 3.2 percent from the previous week to 26.41 million barrels. Stocks were higher than expected and less than 1 percent below the same week last year. Inventories were above the five-year average.

Ethanol exports averaged 174,000 barrels a day last week, down from 188,000 the previous week but up from 111,000 the same week last year.
U.S. ethanol exports in January 2026 totaled 212.1 million gallons (mg), slipping 4% month-over-month. Canada continued to be the top destination with 70 mg of imports. Brazil tripled its imports of U.S. ethanol to 36.4 mg, the largest monthly purchase in nearly six years.
—
PAST PERFORMANCE IS NOT INDICATIVE OF FUTURE RESULTS. FUTURES TRADING INVOLVES SUBSTANTIAL RISK AND IS NOT SUITABLE FOR ALL INVESTORS. -

Soybean prices drop following trade talk uncertainty
Soybean futures fell below $12 per bushel, dropping as much as 3.5 percent, on Monday morning following a potential delay in trade discussions between the U.S. and China. The drop comes after President Trump stated he could postpone a summit with Chinese President Xi Jinping if Beijing does not help unblock the Strait of Hormuz.…
Written by
·
Soybean futures fell below $12 per bushel, dropping as much as 3.5 percent, on Monday morning following a potential delay in trade discussions between the U.S. and China. The drop comes after President Trump stated he could postpone a summit with Chinese President Xi Jinping if Beijing does not help unblock the Strait of Hormuz.
White House Press Secretary Karoline Leavitt said the meeting was not in jeopardy, but acknowledged the possibility of it being rescheduled.
China’s purchases of U.S. soybeans have slowed after reaching their initial target of 12 million metric tons (MMT) of the commodity earlier this year.
Soybean meal and soybean oil prices also declined Monday morning, as much as 2.5 percent and 2.7 percent, respectively.
—
PAST PERFORMANCE IS NOT INDICATIVE OF FUTURE RESULTS. FUTURES TRADING INVOLVES SUBSTANTIAL RISK AND IS NOT SUITABLE FOR ALL INVESTORS. -

Soybean crushings dip in February, remain above estimates, NOPA
U.S. oilseed processors crushed 208.8 million bushels of soybeans in February, up 17.4 percent year-over-year, according to the National Oilseed Processors Association on Monday. Volumes were also above the average trade guess that had predicted last month’s crush at 202.2 million bushels. Soybean oil stocks at the end of the month totaled 2.08 billion pounds,…
Written by
·
U.S. oilseed processors crushed 208.8 million bushels of soybeans in February, up 17.4 percent year-over-year, according to the National Oilseed Processors Association on Monday. Volumes were also above the average trade guess that had predicted last month’s crush at 202.2 million bushels.

Soybean oil stocks at the end of the month totaled 2.08 billion pounds, up 38 percent year-over-year. Volumes were at a 13-year high for February.
—
PAST PERFORMANCE IS NOT INDICATIVE OF FUTURE RESULTS. FUTURES TRADING INVOLVES SUBSTANTIAL RISK AND IS NOT SUITABLE FOR ALL INVESTORS.